Peak Fit Automation - Looking for suggestions


Hi,
I have a large number of Raman spectra (350+ samples with 10 spectra/sample). The fits is to 3 known peaks with figures of merit being positions and some ratios of peak areas.
Looking a way to best automate this process. My idea was to use the general multipack fitting based on a temp wave and then just iterate new data to the temp wave and execute curve fit and scrap the resulting data to a summary wave with sample_id as row label. The standard fitting panel is built around human exploration of the parameters which is great. Is it possible to execute the "Do Fit" button press programmatically? If so I have a clear path to run through the samples.
If not is there a preferred way of doing this? The batch fit still forces me to load all the waves.
Andy
I did something similiar years ago with IP 6.3 for a customer. It uses
#include <Multi-peak fitting 2.0>
and MPF2_AutoMPFit. I can't share the code but I'm able to answer questions ;)
August 10, 2022 at 10:59 am - Permalink
I haven't used any of the fitting packages, so I cannot help you there, but I haven written a procedure for fitting XPS data, including large data sets. I wrote my own fit function for the XPS peak fitting. There are a few general things to consider.
What is your input format? A wave reference wave is a pretty good choice for large number of spectra. It sounds like you want to avoid having to load all 3500+ spectra, but 3500+ one dimensional waves should not take up much memory? Is it because the procedure you use to load the files is slow?
What are your starting guesses for the fit parameters? That can be fairly complicated.
Are the spectra independent of each other, so you can fit them separately or do some of the parameters need to be the same across all spectra, which means you need to fit all spectra simultaneously.
What is your output format? A simple option would be a 2D wave with one dimension being the wave id number and the other the fit parameters.
You also need to present the result in a way so that you tell how well the fit worked. Usually you would plot the measured data and the fit in the same graph, but with thousands of spectra that becomes increasingly difficult.
August 10, 2022 at 11:04 am - Permalink
Multipeak Fit has a function to do batch multipeak fitting- MPF2_AutoMPFit(). In Igor 9 chozo has added a nice UI for the function. But if you need to process the result afterward, it can be difficult to write code that iterates the results for post-processing.
If you truly are fitting the same three peaks every time, and the same initial guesses would always be appropriate, it's probably not to hard to write a specialized function to fit each of the data sets and then post-process the fits. You have already done a lot of such work, I know, so probably not a big deal for you.
August 10, 2022 at 01:22 pm - Permalink
As John said, an easy way of processing spectra like this is to use AutoMPFit. If you have Igor 9, then it should take only a minute or so to set everything up using the user interface (look for Automatic Multipeak Batch Fitting). Of course, you still need a small script to extract the results afterwards, but this is just a few lines of code. If your spectra are extremely simple, then you could also think about setting up a custom fit function and just using FuncFit in a loop.
August 11, 2022 at 07:51 am - Permalink
Hi,
I have tried the MPF2_AutoMPFit() method and while it works, there is one peak that is borderline in intensity that is getting missed sometimes.
I am now looking to explore a FitFunc approach and could use a bit of assistance in crafting the FitFunc correctly.
I have three peaks that I want to fit to Lorentzians along with a linear background. I have use the interactive peak fitting on a representative graph to get the fitted wave and the parameters to use as initial guesses.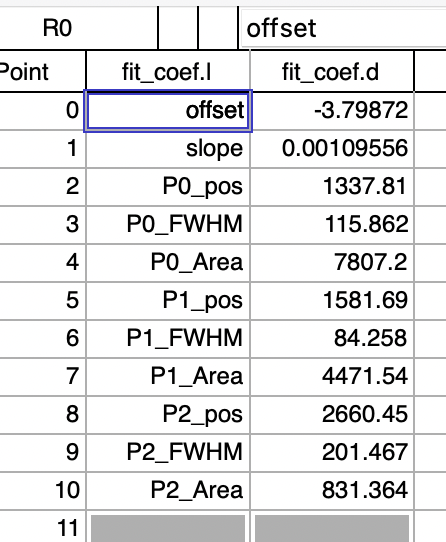
I have started with this and partitioned the incoming coefficients to three distinct fits.
Now if this worked I would be posting. I test this on the same data set that I used in the interactive peak fit and it returns a matrix singularity error. If I try "graph now" in the coef it is showing a flat line.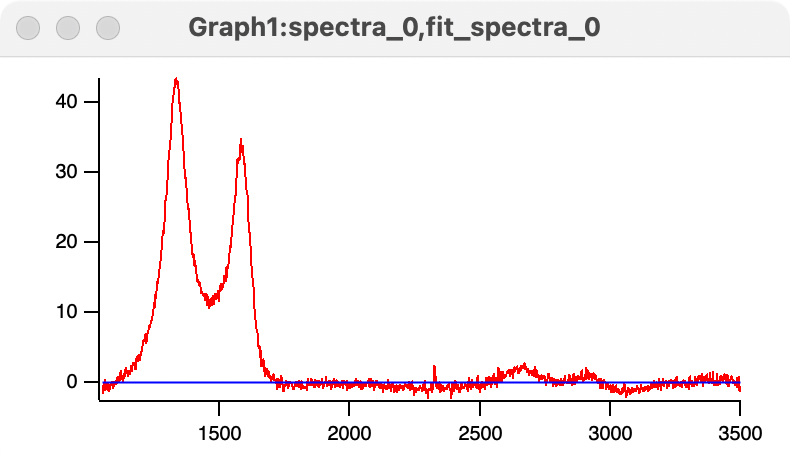
How do I set this up?
Andy
August 12, 2022 at 08:39 am - Permalink
Each call to MPFXLorentzianPeak() needs its own yw wave. Then at the end add the three waves into the real yw. Something like
August 12, 2022 at 11:30 am - Permalink
Hi John,
Still getting errors.
When compiling I get an error that says for MPFXLorentzianPeak I get an error "To invoke a built-in function you must print or assign the result."
So I have created some variable for the assignment and summed them as a stab at a solution. Obviously this doesn't work. As a side note: ("graph now") button yields an error "
It was impossible to plot your fitting function:
The fit data is not on the top graph."
What mods do I need to make?
Also how do I include a linear term for the background?
Andy
August 12, 2022 at 11:50 am - Permalink
Yes, I typed my "code" straight into the reply form without compiling or testing. I forgot about the need to assign the result of a built-in function. Since the result doesn't do anything, you can simply do something like
That also shows how to get your linear background.
I also corrected the fact that you swapped the y and x waves in the parameter list. Igor's fitting is picky that way :)
And this time I actually tested it :)
August 12, 2022 at 02:06 pm - Permalink
In reply to Yes, I typed my "code"… by johnweeks
hegedusHi John,
Thank you very much. It seems to work. Now I just need my data to cooperate.
Andy
August 12, 2022 at 02:15 pm - Permalink
Sorry. Can't help with that :)
August 12, 2022 at 03:46 pm - Permalink
Hi John,
I am working on implementing the fitfunc and I am struggling with the linear offset. I am plotting the fitted curves and they seem offset by amounts that I cannot account for by the slope of the linear offset.
I notice in the manual that there are warning about fitting sums of fit functions and the introduction of errors in the linear offsets.
Is there something I should be aware about to help explain the discrepancies I am seeing.
Andy
August 17, 2022 at 12:50 pm - Permalink
That warning in the documentation is aimed at the situation where there are redundant offset coefficients. The moral equivalent of
where Y0 and Y1 are linearly dependent and will cause a singular matrix error. The MPFXxxx functions don't define such an offset, so that's not a problem.
If you can't figure out what's going on, and would like my help, you know what to do- send everything I need to try out your fit function to support@wavemetrics.com, and I'll see what I can figure out.
August 17, 2022 at 03:02 pm - Permalink