Combine two 3D Waterfall plots


Hi guys,
i having a little trouble with the waterfall plot. I managed to make two Waterfall Plots by using the inbuilt Waterfall Packáge. Windows-->New-->Packages-->Waterfall
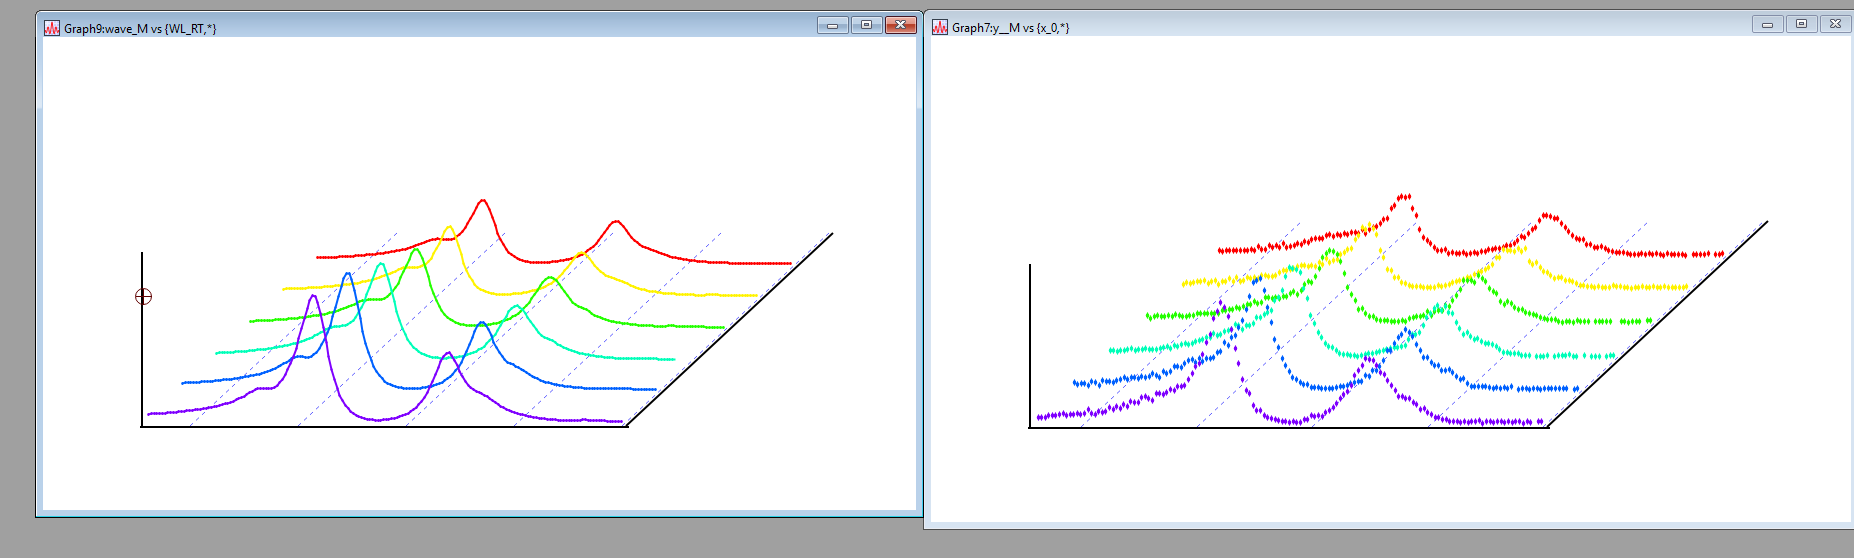
One of these Waterfalls is my raw data, the other one are the fitted data. Now my problem is to show the right raw with the right fitted data in one waterfall plot. Is there a way to do this?
Thanks a Lot!!
Waterfall plots are kind of limited. As you have found, there is no "AppendWaterfall" operation in Igor.
I suggest you need to use a Gizmo plot. You may need to do some work to get what you need, but it will be superior to a waterfall plot.
May 29, 2019 at 02:21 pm - Permalink
Here are more details that may help you get started.
I assume that you are starting from a matrix of values that you would otherwise display in a standard waterfall plot. You need to convert this matrix into a triplet wave that is used by Gizmo path object. Here is how I create the triplet wave:
Next I create a blank Gizmo and add a path object. You can execute the following commands on the command line or manually add the object using the GUI:
At this point you should be able to see your waterfall plot.
Since you hinted at having data and fits I would recommend using the above code for the fits and displaying the measured data as a scatter object.
If you are not sure how to proceed or if you encounter any difficulties, feel free to send a copy of your experiment (or sufficiently similar data) to support@wavemetrics.com.
A.G.
May 29, 2019 at 04:11 pm - Permalink
If you want to try to combine the two plots before trying out the superior gizmo version, here's how you might do it:
Save a recreation macro for Graph 2, and open the procedure window to see the macro.
Change any instances of 'display' to 'appendtograph'.
Bring the Graph 1 to the front, then execute the commands from the recreation macro needed to add and format the second set of traces: select the appendtograph and modifygraph commands, right click, and select execute. There may be some other complications that I haven't anticipated, but this should be a quick way to add the traces with matching offsets and formatting.
May 30, 2019 at 01:10 am - Permalink
Tony- a waterfall plot is made by NewWaterfall, and there is no AppendWaterfall. Igor is simply not prepared to put two waterfall plots on one graph.
May 30, 2019 at 08:49 am - Permalink
In reply to Here are more details that… by Igor
l.timThe Gizmo Plot works really well.
Thanks a Lot for your help.
May 30, 2019 at 11:17 am - Permalink
In reply to Tony- a waterfall plot is… by johnweeks
tonyOh, I see. I had previously used an ancient waterfall package that simply created offsets to make a poor-person's waterfall, but I see now that the waterfall package is already more advanced than that.
May 31, 2019 at 01:45 am - Permalink
Or less advanced :)
It seems like with Gizmo available, a waterfall plot is really a poor second choice these days. But there is a barrier to adopting Gizmo :)
May 31, 2019 at 09:30 am - Permalink