Fitting curves erratic behavior?

I'm new to Igor and, when I was trying to do a non-linear curve fitting, I bumped into this strange situation.

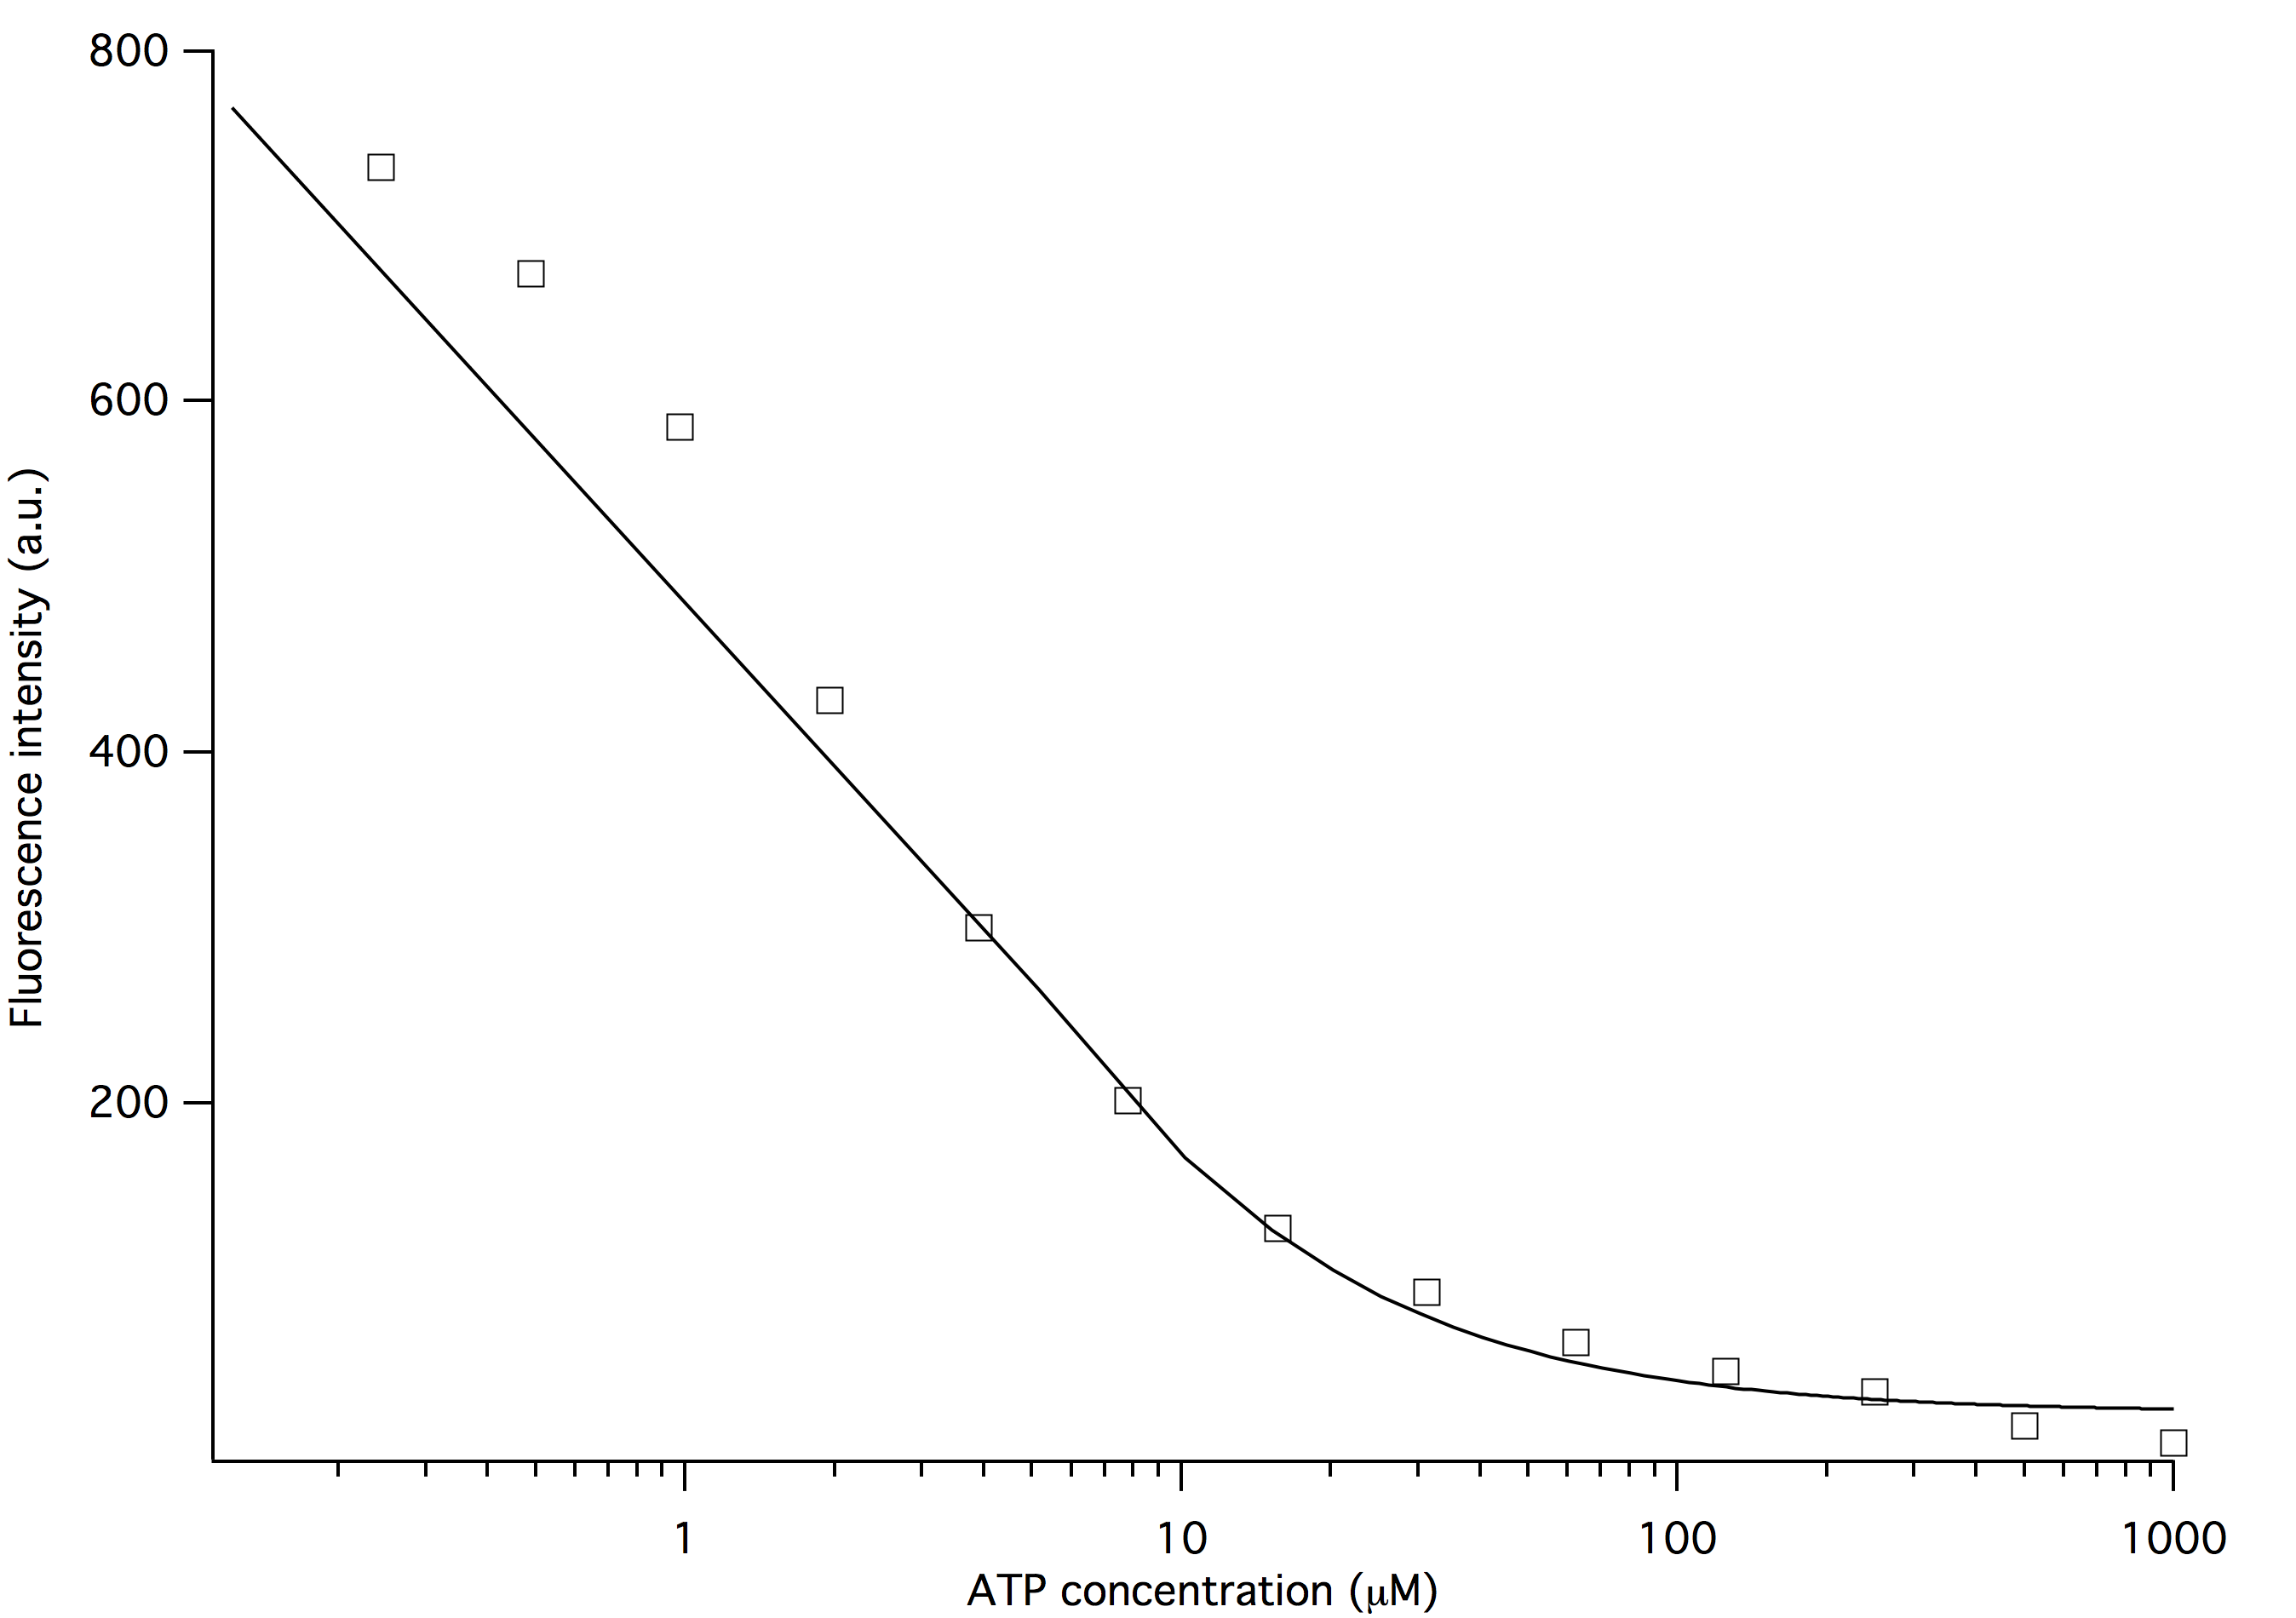
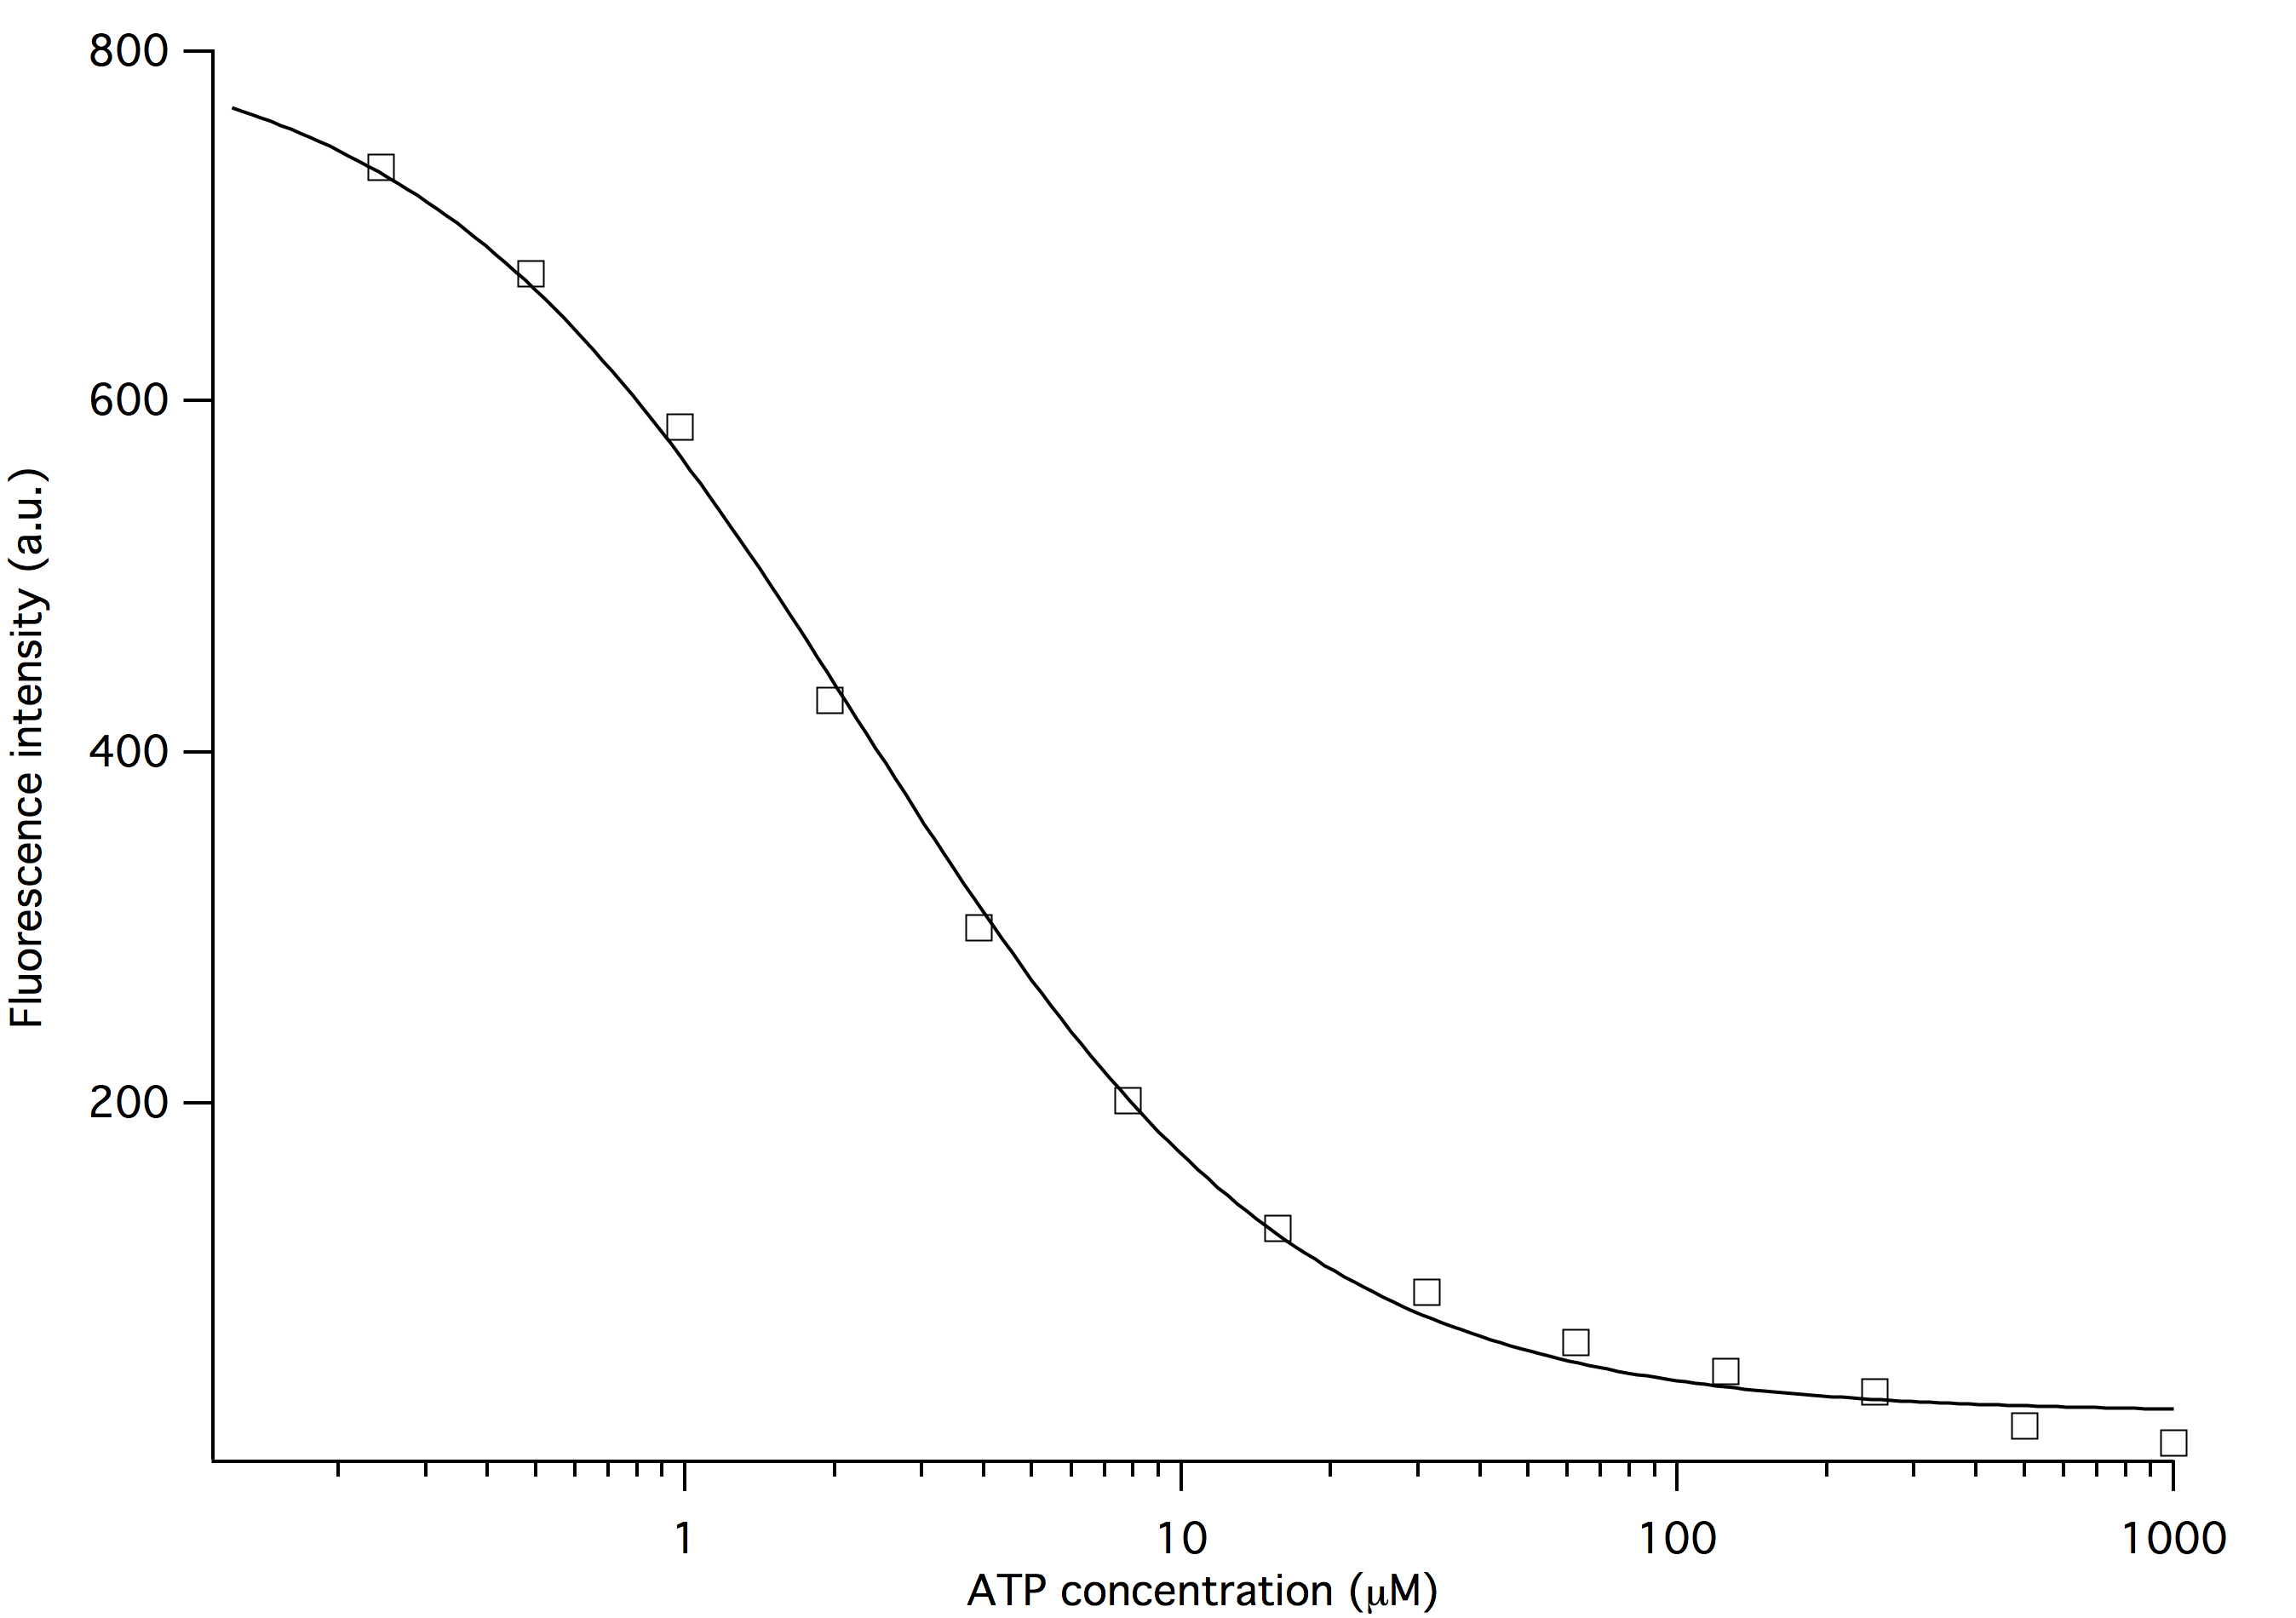
Namely, as the attached image (weirdfit.png) shows, the fitted curve became a straight line for x<5. Despite the apparently incorrect graphics, the parameters I got from the non-linear fit are correct--I used Prism Graphpad to analyze the same data set and the resulting parameters are the same. Also, when I key in the parameters' fitted value in Igor's dialog window and hit 'graph it', I actually got a beautifully fitted curve, with no weird straight lines (shown in correctfit.png)!

Thank you in advance for all suggestions and input!

weirdfit.png correctfit.png
You've probably got the fit result wave set to a fixed number of X points (if you didn't change it I think the default is 200), and Igor will use the wave scaling to set the x values...meaning *linearly* spaced values, not necessarily coincident with your actual data points. That segment of straight line is Igor's plotting routine connecting the smallest two points in the fitresult (change the trace mode to line + markers and you'll see more clearly what's going on with the fit result) There's an option in the curve fit dialog (or a flag if you're using command line fitting) to tell the curve fit to use the X values you supplied for the fit and that curve will look like the one you produced manually. (Sorry for vague description, I don't have Igor open here...but I think that should be enough info)

As you noticed, none of this affects the reported best fit coefficients...the fit routine does use your exact actual X points to find the best fit, but it defaults to a set of points designed to produce a smooth, continuous curve for the destination wave under most conditions.
ikonen is pretty certainly correct about the cause of the weird-looking fit curve- the log axis makes evenly-spaced data look like its spaced far apart at the left and close together at the right. If you do the fit when the horizontal axis is in log mode, the automatic fit result curve will be done with an XY wave pair with exponential X spacing. That should make the curve look correct on your log axis.

John Weeks
WaveMetrics, Inc.
support@wavemetrics.com