How can I fill the contour plot, correctly?


I'm in the process of drawing several contour plots.
While most of them are filling properly, some of them aren't.
Why might this be happening, and how can I resolve this issue?
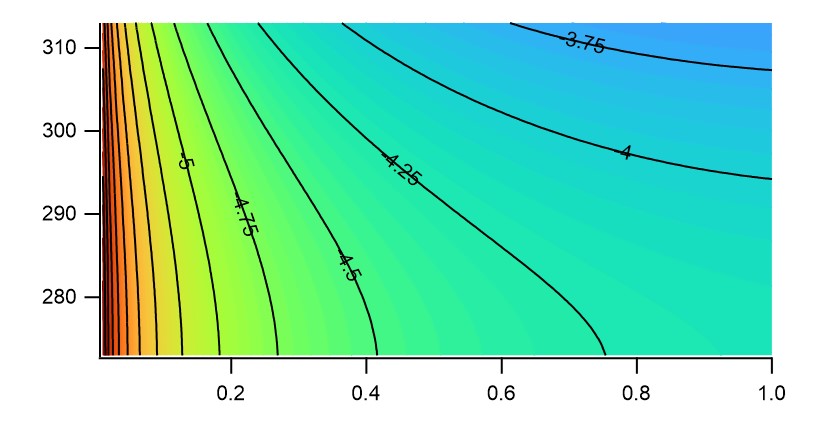
This is the correct contour plot.
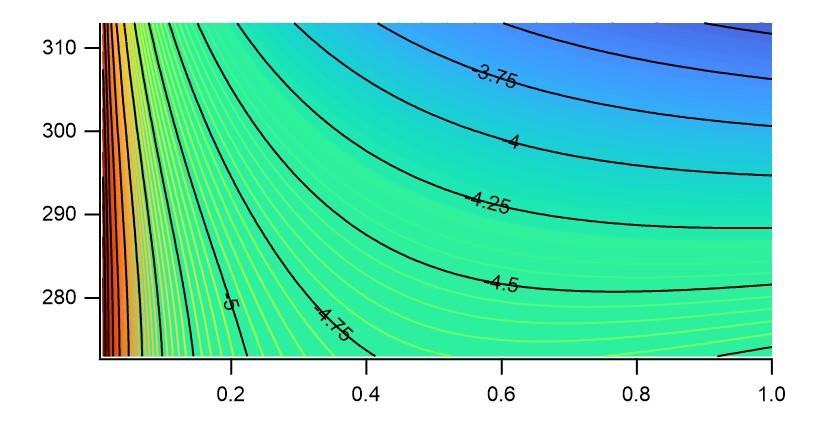
This is the error contour plot where the cyan~red part is not filled correctly.
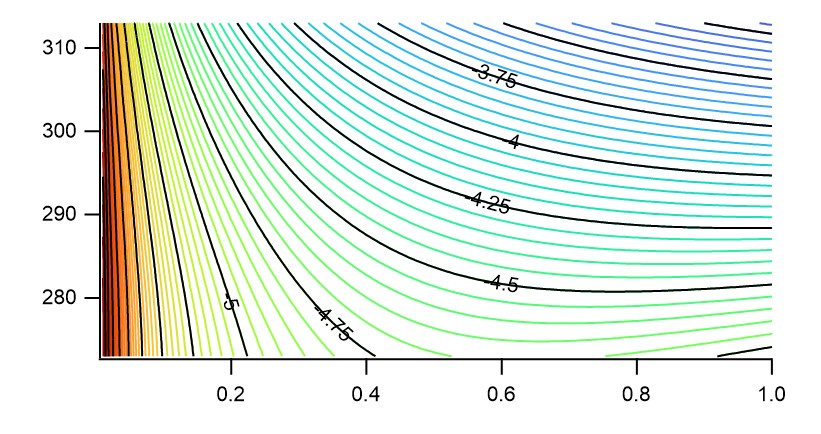
This is the contour plot where only the lines are drawn, excluding the filling, as seen in the error contour plot above.
The color gradient of the lines is correct.
-> I want to fix the filled color of the error contour plot. (second plot)
It is not clear what problem you are seeing in the second plot.
Perhaps if you send the experiment to support@wavemetrics.com your concern can be addressed.
Be sure to explain
April 21, 2024 at 11:38 am - Permalink
If I understand correctly, you want to have a smoothly varying colour that represents the data (or an interpolation of the data, or perhaps a Delauny triangulation) underlying the contours.
The colour gradient is achieved by creating an image wave and displaying that behind the contours. This could be your data plotted with a color table, or you can easily create an image based on your chosen contouring using the wavemetrics procedure "Fill Between Contours".
Execute DisplayHelpTopic "WaveMetrics Image Plot Procedures" to find the Fill Between Contours control panel. Note that this is different from plotting contours with the fill option, which will naturally create a band of colour between each contour.
Make sure you have only one set of contours displayed on top of the image, that you are not using contour fill, and adjust the settings for the contours to get the appearance you desire.
April 22, 2024 at 01:53 am - Permalink
In reply to If I understand correctly,… by tony
sunghh44First, I executed "Fill Between Contours" to fill the contour plot.
That's how I made the first contour plot with smoothly varying colors.
And then I had a problem like what I uploaded question.
Second, I executed DisplayHelpTopic "WaveMetrics Image Plot Procedures" to find the Fill Between Contours control panel.
Somehow, This procedure worked well!
I do not fully understand this method now, but I will study this procedure.
Thank you for your comment!
April 22, 2024 at 07:34 pm - Permalink
In reply to It is not clear what problem… by JimProuty
sunghh44"modify contour appearance" - "fill contours" does not work well.
the color gradient of "fill contours" was stopped at a specific point.
However, I solved the problem using the below comment.
Thank you for your comment too!
April 22, 2024 at 07:45 pm - Permalink