Profiler and dependencies


Dear users,
I am looking to make a panel profiler to process my data. I want to reproduce IgorPro's profiler with just the position and width options. But I don't understand how to link the line displacement on the image and the position. I looked in the WMLineProfile procedure but I didn't see how to make this dependency. Do you have an idea?
Hi,
For the line on the image plot you can use a wave with two points. Set the x scaling to x scale on the image. Then in in your set variable control set the Y value of the wave to that value. In the example below the wave is called two_point_wave_line.
Andy
February 6, 2022 at 05:48 am - Permalink
Sorry, but my question is the other way. How to read the position of the two lines in variable?
February 6, 2022 at 05:54 am - Permalink
You can then use TraceNameToWaveRef to find the original wave and then read the values.
Andy
February 6, 2022 at 06:00 am - Permalink
Thank you but if I understand the basis of igorpro I must have a link between the movements of the lines and the profile calculator. In this case I don't run a function to read the position every time.
February 6, 2022 at 06:29 am - Permalink
The old image line profile package uses the quickdrag feature. To read about this, execute:
then search for "quickdrag". You'll first find the keyword, and then after the list of all keywords there is a section that gives extra information about quickdrag.
You can search through Image Line Profile.ipf for "WMLineProfileDependency" to see how that dependency is setup.
The more modern way to implement this would be to use a graph cursor and a window hook to respond to moving the cursor. For information on this approach, execute:
You can create a graph cursor that is a horizontal line using Cursor/H=3. /H=2 gives you a vertical line.
February 6, 2022 at 09:32 am - Permalink
Thanks I use this method on several procedures, I will try to make this profiler with cursors.
February 6, 2022 at 10:15 am - Permalink
My Image Profile project uses this approach and more (for example, having a 'live' profile below the mouse cursor):
https://www.wavemetrics.com/node/21549
Not that it is easy to extract the relevant code out of such a rather big project, but maybe this can give you some ideas.
February 6, 2022 at 04:34 pm - Permalink
My project is exactly the same but I need to specify it for the photoemission data.
Finally i used this way on windowhook function
February 6, 2022 at 10:07 pm - Permalink
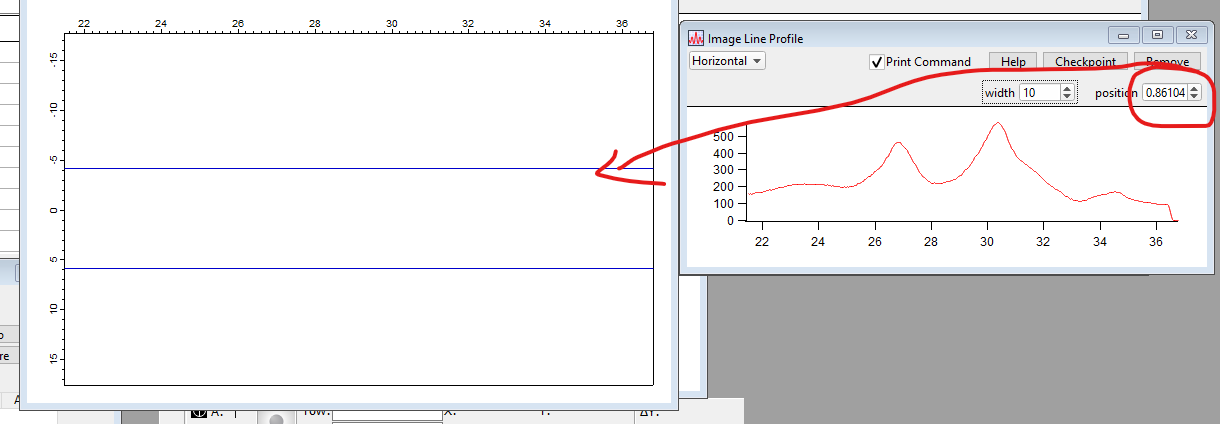
Last question, is it possible to make the slider part on the profile disappear? I reduced the top axis to make the image smaller but the cursor doesn't take this into account.
February 6, 2022 at 10:11 pm - Permalink
Good that you found a quick solution for what you were looking. Some notes about your code:
- You might want to check whether the cursors are actually set on the graph (e.g., numtype(a) == 0) and whether a is smaller than b (if not reverse).
- note that the way you wrote the for loop will not include the value at cursor b in your profile. You might want to set the limit to b+1.
- To get an average profile, you should divide the profile by the number of added points afterwards: profileXY /= abs(a-b)
February 6, 2022 at 10:15 pm - Permalink
So your next question is if you could reduce the size of the cursor hairline to a subsection of the plot. I don't think this is possible (I did not find any setting to control this). In other words, the hairline is always drawn over the full plot area. You can alternatively represent the region of interest with drawn lineshapes (which you would need to update after cursors have been moved) see:
DisplayHelpTopic "Drawing"
or you use the approach used for the old Line Profile tool (or my project above), where the ROI is represented as traces from a wave which you can drag around via quickdrag.See aclight's post.
Both approaches are somewhat more involved than just using cursors, but if you really want to get rid of the excess hairlines, that would be the way to go (unless the WaveMetrics staff presents yet another sneaky trick to make this work after all).
February 6, 2022 at 10:26 pm - Permalink
It is not a critical point, I will work on the content, the form will follow.
Thanks
Th.
February 6, 2022 at 10:50 pm - Permalink
There is at present no way to shorten the cursor hairlines. Maybe in Igor 10?
February 7, 2022 at 12:53 pm - Permalink