Precise Plotting on Image


Hello!
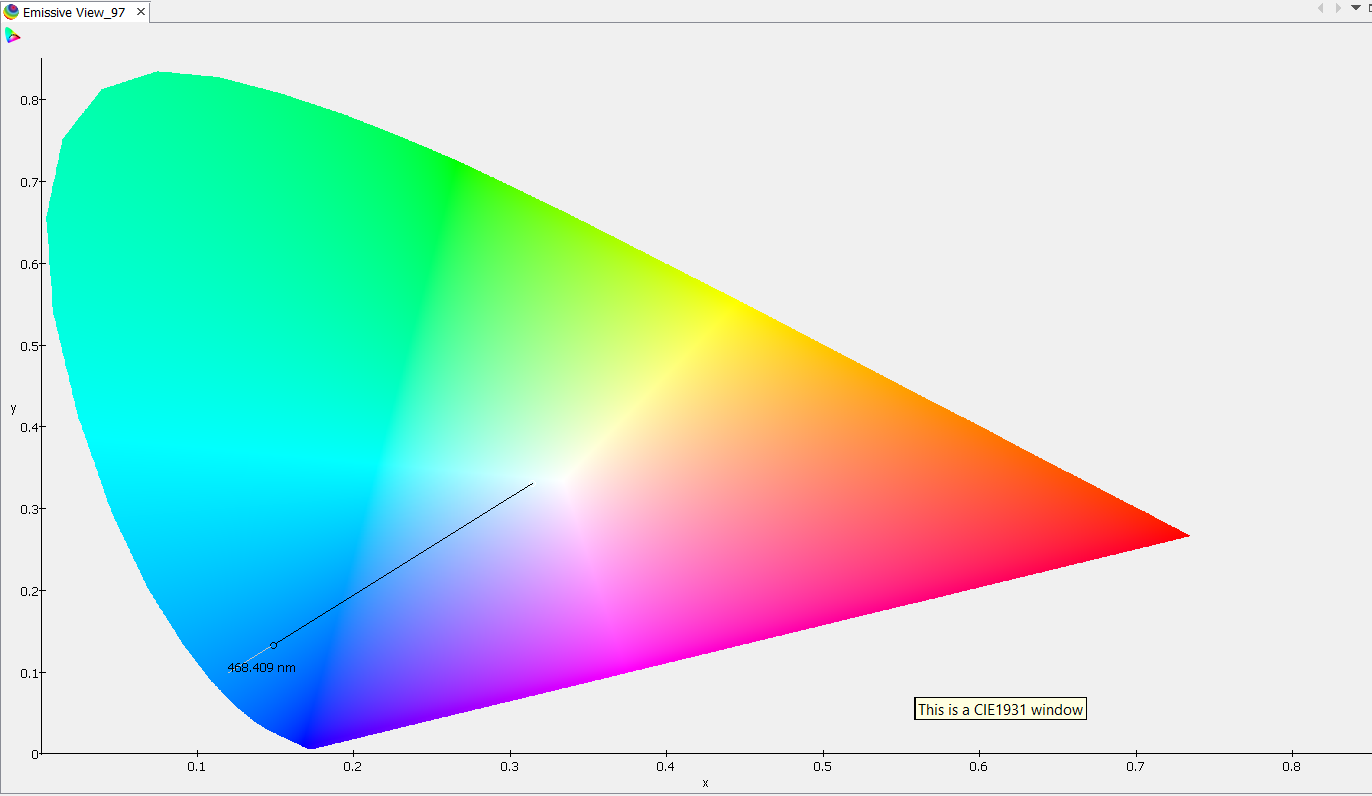
My goal is to obtain the specific color at a particular location in a chromaticity diagram (see attached image). To do so, I first need the XYZ tristimulus values which can be accomplished with help from this site in order to generate the x y coordinates for determining color in a separate application (OceanView). I've done this already (and could post the code if anyone's interested), and am now wondering how feasible it would be to use Igor to perform the plotting. Though one approach could be to recreate the chromaticity diagram, I realize Igor's breadth of functionality might offer an easier solution. After looking through some of the examples, I found the Image Processing Demo which can load an image and apply axes. My question: could this be extended to include some way to determine the RGB values of an image at a very specific location? I can grab a screenshot of the chromaticity diagram from the OceanView however this introduces the problem of manually scaling the window size which may offset the axes a bit.
Any thoughts are greatly appreciated.

Forum

Support

Gallery
Igor Pro 10
Learn More
Igor XOP Toolkit
Learn More
Igor NIDAQ Tools MX
Learn More
Have a look at ImageInterpolate with the Voronoi option.
April 1, 2019 at 09:10 am - Permalink
An RGB image is just a matrix of R, G and B values. If you plot an image in Igor and put a cursor on the image you will see image coordinate and R,G and B values for the pixel beneath the cursor in the information panel.
R,G, and B values within the wave are referenced by the layer index: wave[rowIndex][columnIndex][layerIndex]
If you're generating an image by calculating RGB values as a function of some variables, that could also be - and may already have been - done within Igor, so if you can be a bit more specific about how you're calculating the RGB values there may be some existing code that could be used to calculate whatever you need.
April 1, 2019 at 09:43 am - Permalink
In reply to An RGB image is just a… by tony
david.croweHi Tony,
Thanks for your reply. I forgot to mention that the process in determining the RGB should be automatic, so using cursor information, while clever, could not work in my case. And yes, I've already implemented a way to determine RGB values from the tristimulus XYZ values according to this link, however, I'd like to also display the chromaticity diagram image and visually plot where the derived xy coordinates indicate and to also determine the color of the image at that specific point. This is mainly because my calculated RGB will be off somewhat from OceanView's (likely due to my use of empirical observer functions) so I'd like additionally present the chromaticity diagram.
April 1, 2019 at 11:50 am - Permalink
I am not sure I understand the problem correctly, but do you want to recreate the CIE X and Y axes from the attached image inside Igor so that you can directly read scaled RGB values? Basically this would turn down to rescaling the RBG image matrix after loading so that Igor's axes match the ones in the image. I tried that with your example manually (see the attachment). This is very straight forward: You just need some way to find the point coordinates of two points on the axis and recalculate the wave scaling. I just set cursors on the 0 and 0.8 points each and found the respective point locations. This worked out to...
Now you can read RGB values by using X and Y points. For example:
This is as perfect as it gets, since the image is pixel clean (not even sub-pixel anti-aliasing). The calculation from cursor locations to axis scales could be done semi-automatically with a small script (such as has been done for example in the tracer package by tony). If you know the image is more or less the same all the time (i.e., you know that the axes are always displayed from 0 to 0.8 with a tick of single pixel width) this could also be done automatically by scanning the image for black pixels in the region of the axes.
April 1, 2019 at 07:02 pm - Permalink
The chromaticity diagram (CIE 1931) is well documented through tables and associated equations. If you are using the X and Y axes (as opposed to say UV or other transformations) you can directly convert from XY to RGB. See ImageTransform with the keyword xyz2rgb. I also recommend as a general reference here: http://www.efg2.com/Lab/Library/Color/Science.htm and here: http://www.fourmilab.ch/documents/specrend/.
AG
April 2, 2019 at 06:20 am - Permalink
In reply to The chromaticity diagram … by Igor
david.croweThanks for the links AG; they're quite informative. And I wish I had known about ImageTransform's xyz2rgb, it would have saved me a bit of time but at least now I can more quickly check my own implementation.
Indeed it is! This is exactly what I was looking for Chozo, thank you!
April 2, 2019 at 08:43 am - Permalink