inserting images into graphs


Hello,
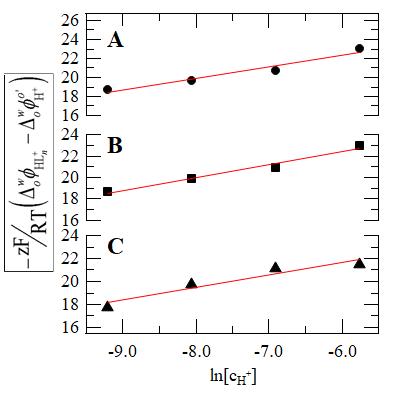
The axis labels that I typically use can be somewhat complex so in past Igor versions I generated them in another math-editing software, saved them as in image, and the copy-pasted them into the graph. Please see attached PNG file.
With my upgrade to version 8, there is this weird box around the image that I can't seem to get rid of; please if anyone can help that would be much appreciated.
Best,
hopper

Forum

Support

Gallery
Igor Pro 10
Learn More
Igor XOP Toolkit
Learn More
Igor NIDAQ Tools MX
Learn More
Perhaps it would help us if you attached a copy of your Igor experiment file, and tell us what software you used for that impressive axis label, along with perhaps a copy of the image file you generated for it.
January 21, 2020 at 10:56 am - Permalink
What OS (Windows or macOS)? What was the previous version of Igor Pro?
I might hazard a guess that your image has a transparency setting (alpha channel) whose presence/absence is inadvertently causing the newer version of Igor Pro to create a bounding box with a border. Otherwise, I might ask ..
* Is the source image a PNG, JPG, EPS, or PDF?
* Did you try converting the source to one of the other formats, importing the other format into Igor Pro, and pasting the other import as the label?
January 21, 2020 at 11:45 am - Permalink
Hi Sorry for not putting more information into my original post. I'm using Windows 10 OS and MathType is the math-editing software I'm using. Mathtype only exports as GIF without any other options. I'll try converting it to another format an importing it to Igor.
My old version of Igor was version 7.
I hope that helps. If you know of a better way to do it, please let me know!
Best,
hopper
January 22, 2020 at 07:21 am - Permalink
Here is another related datum. Using the MathType equation editor (version 6.9b), IP 8.04.64-bit, Windows 10, I was able to create and paste Greek symbol sequences as figure captions without seeing a bounding box around them.
January 22, 2020 at 07:30 am - Permalink
hopper- I'd love to have the Igor experiment and the GIF with the picture of the equation to check out here. These days, I seem to be the guy that debugs problems with pictures. I'd like to examine it and see if that frame is something that Igor is doing because you turned it on, or we are doing something different, or if maybe the picture has that frame in it. Or something entirely unexpected, which happens pretty often in software :)
January 22, 2020 at 09:36 am - Permalink
Thanks John, please see attached the Igor file and the GIF file (as a zip file as gif isn't allowed) from MathType. I hope it helps!
I'm still playing with the MathType settings but I am using version 6.9d... maybe that's the problem?
Best,
hopper
January 22, 2020 at 01:23 pm - Permalink
Well, I tried!
Of course it doesn't look as nice, but sometimes I can't resist the 'challenge' of axis labelling in Igor.
January 22, 2020 at 02:19 pm - Permalink
That's awesome Tony! Thanks so much!
Best,
Jane
January 22, 2020 at 02:32 pm - Permalink
In reply to \Zr400\F'Times'\[0\S-zF\M… by tony
hrodsteinWell, I tried!
And you succeeded. An impressive display of the cryptic art of Igor annotation programming.
January 22, 2020 at 05:24 pm - Permalink
In reply to \Zr400\F'Times'\[0\S-zF\M… by tony
tonyIf you want to go the Igor route, you'll likely want to change the \Zr400 at the start to a smaller multiplication factor...
The advantage of Igor axis labels is that they scale with the graph window size. (and the disadvantage of Igor axis labels is that they scale with the graph window size. Unless you replace the \Zr with a fixed size.).
January 22, 2020 at 11:16 pm - Permalink
Many thanks again Tony! I've played with the settings today and I'm really satisfied with it!
Best,
Jane
January 23, 2020 at 08:58 am - Permalink
With Igor 8 and above, another option is to us Igor TeX format:
If you're already familiar with LaTeX, it's easier to get a complicated formula with Igor TeX than with Igor's standard styled text codes, though the results may or may not be as visually appealing.
Here is a command that creates a text box with your formula:
January 23, 2020 at 09:08 am - Permalink
In reply to Many thanks again Tony! I've… by hopper
hegedusHi Hopper,
Just curious, why not use a single Y axis since the scales and ranges are similar. To the eye it would comparisons among the three lines easier.
Andy
January 23, 2020 at 10:08 am - Permalink
Many thanks aclight! I am just learning LaTeX so this another reason to get into it!
Hi Andy, the overlap in the curves made the linear fitting look messy, but this is a first draft for the manuscript so my co-authors might agree with you. The y-axis label will not change, however.
Cheers,
Jane
January 23, 2020 at 10:28 am - Permalink
> I am just learning LaTeX so this another reason to get into it!
I'll add a word or two of encouragement. The benefits to be gained from learning LaTeX when working in a math, hard science, or engineering discipline go well beyond just being able typeset equations.
January 23, 2020 at 12:48 pm - Permalink
@hopper Thanks for posting the files. I can see the black box, too, but haven't yet tried to figure out where it is coming from. I'm a bit confused- the picture you used for the label is an EMF (Enhanced Metafile) but the file you posted is a GIF. Did you create the picture in Igor's picture gallery using copy/paste? or some export file from MathType?
In fact, Igor 8 can't load a GIF into the picture gallery on Windows, so your EMF must have come along a different route.
January 27, 2020 at 11:35 am - Permalink
I'm impressed with Tony's efforts/results.
I may be in a minority but in my experience, the benefit of a rotated left axis label is reduced dramatically with its complexity. Even at the size of the label as it appears here (it may appear even smaller in a publication), it is rather difficult to read. IMO, a better approach is to use a symbol for the quantity displayed on the left axis which is then defined either in a figure caption or in the text where the full details of the equation are clearly legible.
A.G.
January 28, 2020 at 11:45 am - Permalink