Bin-centered X values on Histograms


I am trying to make a histogram of some data I have:
| 12.5 |
| 16.4 |
| 16.6 |
| 18.0 |
| 18.6 |
| 22.3 |
| 23.4 |
| 23.7 |
| 28.1 |
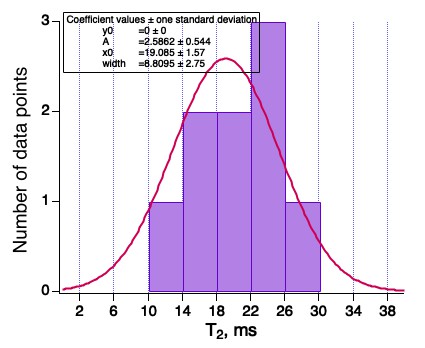
I have chosen 5 bins with width 4 and bin start 10. When I plot this histogram, everything seems fine. I have attached an image of this (Graph 21).
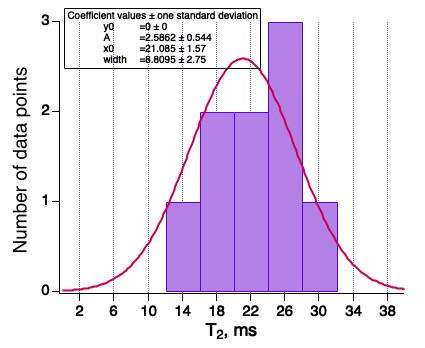
However, I apply the bin-centred X values for the purpose of fitting a graph through the centre of the bin and, the bars on the histogram appear to show incorrect data. I have attached an image of the wrong data (Graph 16). I believe the issue is because the bars now begin at the bin centre, because if I represent the data with a marker and line instead of bars, the data appears correct.
Is there any way I can fix this such that the graph is fitted through the centre of the bins but keeping the histogram displayed correct with bar mode?

Forum

Support

Gallery
Igor Pro 10
Learn More
Igor XOP Toolkit
Learn More
Igor NIDAQ Tools MX
Learn More
I dealt with this in one place and I eventually created different x-wave for each set of data - but in this case I have xwave and ywave pairs. If you are using x-scaling, you can shift the bar graph using Offset option in GUI, so it is centered by shifting it by half of the bin width. This applies command ModifyGraph offset={-2,0} in your case. If you do this only for the bar graph, it will look as expected and is easy to do through GUI.
March 30, 2020 at 08:22 am - Permalink
You have analyzed the source of the problem correctly. It is a difficult problem that has no terrific solution. The various things you can do are discussed in our help: DisplayHelpTopic "Curve Fitting to a Histogram".
March 30, 2020 at 12:00 pm - Permalink