How can Igor make managing lots of windows easier?


Igor users often have 10s or more windows open at once, and many users don't have monitors large enough to keep all of these windows open without them mostly overlapping. We would like to provide better tools for window management in a future version of Igor, and want to get some feedback from users about how to do this.
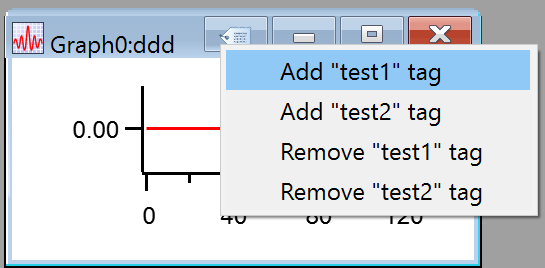
One possibility we've come up with is to allow windows to be assigned one or more tags (eg. "dog" and "cat"). Tags could be assigned using:
- a new SetWindow keyword
- a new menu item
- the window browser
- a new popup control that would be accessible directly from the window's title bar, such as displayed in this very-simplified prototype
We would then provide a way for users to view only windows with a certain tag (other windows would be hidden). This could be accomplished using:
- a new menu item
- the window browser
- a button in Igor's toolbar for showing tagged windows
- a user-defined function that used GetWindow or WinList to determine which windows are tagged
Window tags would likely only apply to the same window types that GetWindow and SetWindow apply to (graphs, tables, panels, layouts, notebooks, Gizmos, and camera windows).
Some of you might recognize this concept from ACL_WindowDesktops package I wrote over 10 years ago.
Macintosh users might suggest the use of Spaces to accomplish something similar. Unfortunately, Igor doesn't work that well with Spaces, and Spaces isn't available on Windows.
If you have comments on the proposal above, or if you have your own suggestions for how we could improve management of lots of windows, please let us know.
Thanks
Using tags is a great idea!
Nothing really works that well with Spaces.
October 11, 2018 at 11:44 am - Permalink
These tags sound good!
Could we have tags for procedure windows as well? I would think setting the tags via a #pragma is the right thing to do in that case. I imagine grouping procedure windows by type, e.g. procedure windows with recreation macros, or tests, etc.
October 11, 2018 at 12:29 pm - Permalink
I wrote a macro for this purpose at the request of our users in our lab because they typically have so many graph windows open at once during data analysis. This macro assigns graphs to different 'groups' which are just names that the user enters into a list. Then you can choose to show or hide all the graphs in that group. You can select multiple groups to operate on. Further comments in the enclosed macro in case that gives anyone some ideas...
Ken
October 11, 2018 at 03:00 pm - Permalink
I like the tags concept as presented.
I would like to be able to select multiple tags for simultaneous display.
It would be very convenient if tags became submenus in the Windows:Graphs menu.
Similarly, tags should be saved with graph macros so that the Graph Macros menu can also have submenus.
For exploratory, interactive data analysis, it would be super helpful to have a simple way to automatically tag windows at creation, perhaps via some preference settings. A better method would be to have something like a pragma statement in the procedure menu so the auto-tags could be selected per experiment.
Automatic tags could be:
-Name of active folder when window was created.
-Path of active folder when window was created.
-Name of the first trace in a graph
-Name of the procedure running when the graph was created.
Auto tags probably would have to be their own submenu in the Graphs menu. And there are probably lots of complications with this. But it would really help me find the right graph after I’ve made 30 of them all with similar wave names.
October 11, 2018 at 06:04 pm - Permalink
Indeed, the building up window chaos is one of the small annoyances in Igor (another one would be the scattered Modify Axes dialog). I try to chip in with my two cents (by the way, I am talking from a Win perspective):
I am actually not too excited by the tag idea. It would be another thing to insert, modify and keep track of just to organize graphs. I guess users are working on only a few graphs while keeping the others in the background. But currently you cannot make a graph smaller without actually destroying the the finely tuned size or minimize it without putting it into a sea of unrecognizable 'tetris-blocks' at the bottom of the screen. Yes, there is the window browser, but I have yet to implement it into my workflow.
How about making the graphs freely resize-able and, if necessary, ordered in tiles while keeping the original properties (real size, axes etc.) the same as well as providing a mini-preview of minimized graphs visible all the time? The former is kind of a 'word processor' approach. You just zoom with the mouse wheel: Make graphs bigger you want to work on and zoom out to see an overview. The latter may be combined with the tilled view often found in photo manipulation applications.
The window browser goes in the right direction. I am actually missing a 'minimize' button to send graphs to the stack (but I guess I just could switch to a workflow of hiding graphs). Also adding a way of making graphs appear on the current screen (e.g., in front of the window browser) and not always at the original position with may be completely out of view, would go a long way.
While I am at it, I might as well suggest another feature: How about introducing graph snapping (on edges and corners) to not only make organizing graphs more easy but also helping in making graphs the same size (short of actually fixing the size for good). Dragging a graph or a graph edge would then snap to the nearest edge / corner of a nearby graph if a few pixels away.
So in short, I would rather like to see a boost of the window browser + easy zooming and snapping features than tags.
October 11, 2018 at 07:19 pm - Permalink
Would "easy zooming" be satisfied by using the graph Expansion setting?
October 11, 2018 at 10:10 pm - Permalink
I'm always in favour of new features, but I'm wondering if I would use it. I don't do tagging of files in macOS for example even though the ability has been there for years. As chozo says it's another thing to keep on top of.
I am a reformed zillion-window Igor user. I did at one time make lots of windows and have routines for tiling and organising them but otherwise have chaos. Now, if I need to make lots of graphs - I keep them hidden. I use a prefix string to the window name and then use this to array windows with that prefix into a layout and save out to PDF, or to show the windows if I need. I tend to have everything coded up for reproducibility reasons and only do a little bit of manual exploratory graphing. I see the tags being useful for the latter case but not so much if you are doing automated data processing.
October 11, 2018 at 11:56 pm - Permalink
I would like to expand on topchem's ideas:
I often organize my data in datafolders. Thus, an option to show or hide all graphs containing items from a selected folder (or hide all except those with items from the selected folder) would be helpful. Ideally, there would be a function to do this, but also a right-click menu item from the databrowser and a global option for this to happen automatically when switching folders.
October 12, 2018 at 01:16 am - Permalink
In reply to I like the tags concept… by topchem
aclightAre you making these graphs manually/with the dialog, or from Igor code? If the later, then you could simply explicitly set the tag(s) on the windows after you create them.
A problem with automatically tagging windows is that there is probably an endless array of possible algorithms that users would want to use. I'm not sure I would have ever thought of any of your possible algorithms. As imagined, you could always use AfterWindowCreatedHook to apply any tags you wanted.
October 12, 2018 at 07:07 am - Permalink
In reply to I would like to expand on… by mario_d
topchemIf there was a "like" button in the forums, I would be using it on mario_d's suggestion.
-Andreas
October 12, 2018 at 07:16 am - Permalink
In reply to topchem wrote: Auto tags… by aclight
topchemFor exploratory analysis, it's usually manually created graphs, with liberal use of re-applying commands from the history to different data folders. Sometimes there will be very short code snippets (3-10 lines) that become procedures that are manually applied to a handful of folders. I typically don't have the foresight to add meta information to window names/titles/notes in these.
If I'm creating 100 graphs programmatically, adding tags in the code is no problem. It's the manual stuff I do before I decide what to code that's at issue. This is where computers are supposed to help overcome our feeble, undisciplined human minds.
As mario_d pointed out, it's not necessarily the ability to automatically tag graphs that matters. What's important is the ability to find things without needing manual (or coded) intervention to tag them. That is mostly the ability to search on meta-information other than the graph name/title and wave name (the latter being somewhat available in the graph browser although I would want to have partial name matches in addition to the wave list). The most important of those being data folder associations (since that's how most data is organized).
To me, the features where Igor stands heads-and-shoulders above things like Matlab or Python is the discoverable GUI (with the ability to easily turn history into code) and the data organization provided by folders and the Data Browser. Sure, I could code data structures in Python that replicate folders in Igor, but I would never do as good a job as the Data Browser.
Typically what I want to do is view all graphs containing the same wave name across data folders or all graphs associated with a particular data folder (or a particular set of data folders)
-Andreas
October 12, 2018 at 07:42 am - Permalink
With regard only to management of multiple graph windows, Adam mentions ACL_WindowDesktop as a basis for the approach being considered. I still find the package easy to use and highly useful. I can see how it could be modified to use tags rather than "desktops", and I support this idea.
With regard to how best to improve the ability of Igor Pro to slice across masses of data efficiently and automatically to display it, I wonder if that theme should not be the subject of its own thread?
October 12, 2018 at 09:44 am - Permalink
mario_d and topchem:
That's an interesting idea, and it also happens to be fairly easy to implement in procedure code. I've attached a procedure file (tested with IP8) that implements what I think you're asking for.
You can call ShowGraphsWithWaveInCDF() directly (or possibly create a user-defined menu item with a shortcut that calls it). If you want it to automatically be called whenever you change the current data folder from the data browser, you could execute:
I can't think of a way to have this called whenever the current data folder is changed from outside of the data browser, and I'm not sure you'd want that, since that could have unexpected behavior (eg. you call SetDataFolder in a function and all of the sudden the visible windows change).
I haven't tested this with a large number of windows and lots of waves within a data folder, so I'm not sure if it's practical to do this via procedures in those situations. Maybe one of you can give this a try and let me know how it works.
I don't think it would be too difficult to build something like this into Igor, but I'm not sure how we could provide the user interface to turn this on/off and control how it works in a straightforward way. Maybe it's something best left to procedures, so the user can have more control over exactly how it works.
October 12, 2018 at 12:00 pm - Permalink
I agree the tags could be handy, and I'd be happy to see them added into Igor.
One other useful functionality that comes to mind would be a modified "bring to front" hotkey that lets the user cycle through windows and preview them, eventually choosing one that will actually move to the front (much like windows alt+tab).
This could possibly be implemented with the hotkey bringing the window browser to the front, allowing the user to keep clicking the hotkey until a window is selected, and then restoring the window browser to its original state.
It would even be nice to combine this with the proposed tabs by allowing the user to pre-assigning match strings to hotkeys for the preview function. Maybe that could also be handled in the window browser.
October 12, 2018 at 01:32 pm - Permalink
In reply to mario_d and topchem: That's… by aclight
topchemI also didn't test this with a large number of windows, but it works as desired for its scope.
I wouldn't tie this to the active folder, but I would like to have this be an accessible selection option in the Graph Browser.
Alternatively, this could be a contextual menu in the DataBrowser, but instead of acting in the active folder, it would be in the one being selected by the contextual click. In that case, there would need to be a further options for whether to merely show/hide or bring to the front/back.
October 14, 2018 at 07:46 pm - Permalink
In reply to Would "easy zooming" be… by JimProuty
chozoOK, I've learned something new today (again! I did know about the 'magnification setting' by the way). I guess that covers the 'easy zooming' part. Actually, I am used to zoom with ctrl+mouse wheel from other applications. Would something break if this behavior would be implemented in Igor too?
May I suggest some method to 'zoom' the view in the window browser too. Together with a button to minimize/recover graphs this may change my work-flow already by a long way. Again, window snapping either to each other or to some background grid would also make things tidy.
I cannot see myself using tags or folder views anytime soon, though (I am all for more power to the user of course!).
October 15, 2018 at 01:05 am - Permalink
In reply to Indeed, the building up… by chozo
jcorDitto.
The functionality described in the first post would be a duplicate of the new Window Browser's (and Igor 7 Graph browser's) filter by name function, which automatically adds * before and after any search strings, so one just has to name graphs systematically ("tag" using the name) to get that.
What would help me reduce confusion is a better integration of the Data Browser with the Window Browser. If DB could be stuck to the left of the WB, and the command window below, then the whole Igor experience could become streamlined and centralized. Windows might even somehow be "stuck" inside the WB to avoid confusion.
October 15, 2018 at 09:48 am - Permalink
In reply to JimProuty wrote: Would … by chozo
aclightI've attached a procedure file that makes it possible to use Ctrl/Cmd + vertical scroll to change the expansion of a graph window. To use it, put the attached procedure file (or a shortcut to it) within your Igor Pro User Files\Igor Procedures directory. Then restart Igor. This should allow you to use Ctrl+Scroll in new and existing experiments. I haven't tested this exhaustively, but it seems to work after some brief testing. The code could be modified to support changing the magnification of layouts also
In the window browser, you can click the settings button at the bottom of the window list (the gear icon) and then change the thumbnail size setting. I'm not sure if that's what you're looking for.
If you select multiple graphs in the window browser, and then click the Hide button and then the Show button, all minimized graphs (as well as non-minimized) will be shown. Clicking the Show button alone does not show a minimized window that is not hidden. That might be unexpected. The show button works the same way as SetWindow hide=0 or DoWindow/HIDE=0. Perhaps clicking the Show button should restore minimized windows as well.
I think the closest we currently have to this is Windows->Control->Tile or Stack Windows (or the TileWindows and StackWindows commands).
October 15, 2018 at 11:21 am - Permalink
In reply to aclight wrote: mario_d… by topchem
aclightI don't understand what you mean by this.
Unfortunately, it's not possible to add user-defined menu items to the Data Browser's contextual menu. But you could use the Execute Cmd... button to call something like what I wrote on a data folder. You could also add a user button (see ModifyBrowser appendUserButton that calls a function you write that calls GetBrowserSelection and then shows graphs for that data folder.
October 15, 2018 at 11:27 am - Permalink
In reply to JimProuty wrote: Would … by chozo
JimProutyCtrl + and Ctrl - generally work to zoom/unzoom most Igor windows. Not quite a mouse wheel convenience, but not bad, IMNSHO.
October 15, 2018 at 05:39 pm - Permalink
In reply to chozo wrote: OK, I've… by aclight
chozoOK, thank you for the effort. I am not such a fan of inserting hooks to everything, since I worry to run into problems when giving file to others. I think ctrl+/ctrl- will do, as Jim pointed out.
Thanks, I didn't notice that. Not as responsive as a key press or slider but good enough for the browser I guess.
Double-clicking a minimized window in the browser will show it, so thats OK. What I actually meant was the ability to also minimize graphs via the graph browser, for example to minimize a large number of graphs. It is not that problematic, but I see it as a discrepancy between working with graphs directly (usually minimize/recover, since you have to know the extra key to press for hiding a graph) and the window browser (hide/show).
I sometimes use the feature to recover graphs out of sight. The biggest problem is that these commands will alter the size of graphs that are not specifically fixed in size, which is unfortunate in some cases. I do not go through the hassle of fixing graph sizes for powerpoint presentations or reports, but still want the graphs to be kept in size. May be a bad workflow, but still.
October 15, 2018 at 06:51 pm - Permalink
In reply to topchem wrote: I wouldn… by aclight
topchemHave a selection parameter in the Graph Browser or Window Browser for all graphs with waves in CDF, selectable by a dropdown menu (like for the wave selector) or similar discoverable UI element.
Together with one for all graphs containing waves named xxxx (with wildcards allowed in the name) in all subfolders of CDF (potentially with the option to recurse N levels deep).
And potentially others.
The point being that to make managing lots of windows easier, is to a large degree about making it simple to select groups of related windows for hiding/showing. Tags are useful for that but they are essentially metadata that has to be explicitly added by the user. It would be nice to exploit the metadata that already exists.
October 15, 2018 at 08:55 pm - Permalink
I agree that a window organization system would be helpful, and automatic metadata is a good way to start. I view the "tags" as essentially an extension of the window title and window name; already I'm sloppy about actually using those two fields logically. Unless your windows have useful names, the old window browser wasn't very helpful, and the same would be true of manually-added tags. The new window browser in Igor 8 is definitely an improvement; by the way, it's confusing that there's two "window browser" options in Igor 8 that are named the same thing.
The "mission control" / "show application windows" functionality in Mac OS / OSX has been my primary way of managing my typical overkill of windows open. It shows smaller versions of all open windows, and it's usually easy to select the right one. However, this is nonexistent in the Windows version. Even in the Mac version, with the Igor 7 & 8 updates it has become somewhat less useful since the "show info" and "show tools" bars are treated as their own windows. Could Igor itself implement a version of this functionality, perhaps with a combination of the Expand and Tile capabilities? I'm envisioning a situation where a keyboard or mouse shortcut could zoom out all the windows (or perhaps all maximized windows), tile them, then the user could select which one/ones are important and bring those to the front and re-expand (and perhaps retile them).
The mouse wheel to zoom idea is interesting and useful, and easier than ctrl-+/-, but would need some work: in my quick testing, it was easy to mess up the graphs by accidentally scrolling when the mouse is over the axis which changes the axis range.
October 19, 2018 at 10:21 am - Permalink
I ran into the same problem that I had many dozens of windows that were hard to manage.
My solution was to write a whole set of procedures for windows management, and a little gui going with it. Here's how it works:
What I did was make a custom window with about 20 or so buttons on it (the number is adjustable), each corresponding to a "windows layout" or windows arrangement. The buttons are labeled with a name that I'm specifying on the fly, and clicking on them brings up the arrangement of windows I previously stored under the button.
- If I control-click on a button, a window pops up asking me for a label for the current windows arrangement. The button label will be renamed to that string, and information about all the graph and notes windows currently visible and not minimized will be stored in a little data matrix I used for storage.
- If I normal-click on that labeled button, all windows that were previously stored under that label will be restored, all others will be hidden (not just minimized, so they don't clutter up the bottom of the screen). They will also be moved to the locations in which they were initially stored. This allows me to easily switch between windows arrangements, and is the core of what makes this useful.
- If I shift-click on the button, all windows stored under that label will be shown, but others will not be hidden and remain visible. This essentially adds the arrangement/layout to the current windows, so I can show two sets of windows at the same time.
- If I alt-click on the button, the topmost window will be added to the list of windows stored in that arrangement/layout.
Everything else I've needed to do can be done with a sequence of the above.
This seems to satisfy most of my needs for managing many dozens of windows, and easily and quickly switching between sets that are most useful to be shown together. The information about the windows (the windows in it, their locations, and the name of the set) are stored in a subdirectory i created for the purpose.
There are still some shortcomings, and many ideas for improvements, but the routines satisfy 95% of what I need to do. I can try to share the code, but would have to extract it from other code that's currently interwoven with it. I can do that though it there's some demand.
Anyway, having some system like this integrated into Igor would work quite well for my purposes. No window tagging etc necessary, but it requires a little data tracking somewhere else.
October 29, 2018 at 12:19 pm - Permalink
In reply to I ran into the same problem… by mph4
jjweimerI like this approach.
Perhaps rather than tags on Windows, we just need a way to store arrangements of windows as sets. It seems to be an expansion of WindowDesktops.
Why not just develop the WindowDesktops package as a built-in and expand on it with the above approach?
October 29, 2018 at 04:11 pm - Permalink
There have been some good ideas above, and I just want to comment that the good ideas seem to be targeting viewing multiple windows on large screens. I personally am often viewing 1 window at a time on a smaller laptop. I don't know which is more common.
October 31, 2018 at 08:18 am - Permalink
I've decided to share my code here that I've been using for managing large numbers of windows and graphs. It's in the experiment file I've attached. I put in a little help notebook inside to help you use it.
I've described the routines in my post above - they've been tremendously helpful for me managing many dozens of graphs in a single experiment file.
Let me know if you find this useful!
November 29, 2018 at 06:09 pm - Permalink
In reply to I wrote a macro for this… by kaikin
mph4@kaikin : Just now managed to take a look at your code. These routines are cool!
They're somewhat similar to what I wrote for myself (see attachment in later comments, if you want to check it out). I also define multiple groups with windows in them, with a slightly different approach.
Some differences between our routines:
One feature my set of routines has is that a window can belong to multiple groups, which I found useful. My user interface is also somewhat different; the predefined buttons allow me to switch groups quickly with a single click. The groups also store window positions, so a window can have a different position depending on which group I recall. This allows me to manage up to 30 groups without running into issues.
What I don't have and like in your features is a) being able to visually scroll through the list of graphs, and b) being able to go through all the windows and assign a group to them. I also like the tiling idea, but wish it wouldn't resize windows.
Cheers!
November 29, 2018 at 06:53 pm - Permalink
I have a related question. Are there any tricks to manage a large number of graph macros? It gets hard to find the graph you want in the Windows/GraphMacros tab once there are more than about 20 macros? Is there a way to create subtabs within the graphMacros tab, since I often repeat the same analysis on different sets of data, each in their own data folder? I'd be open to try other workarounds if people have found useful ones. I checked out the manual, but didn't see anything that fit the bill.
September 1, 2020 at 11:22 am - Permalink
In reply to I have a related question. … by jmcclimo2003
aclightYou can write dynamic user-defined menus to do this. Use the following commands to bring up relevant documentation:
September 1, 2020 at 11:27 am - Permalink
Another method: with the Procedure window as the active window, hold down the Option key or Alt key, pull down the Windows menu, go to the Graph Macros menu and select a macro. Igor will highlight the selected macro in the Procedure window. This only works if the active window is a procedure window.
September 1, 2020 at 11:34 am - Permalink
Thank you John and AC! I will try these tips out.
September 1, 2020 at 11:37 am - Permalink
@jmcclimo2003: I'm using https://github.com/byte-physics/igor-code-browser for browsing igor code. It also shows window macros. Or you can try the builtin procedure browser (Window->Procedure Browser).
September 1, 2020 at 01:02 pm - Permalink
Expanding on @aclight , I'm also using menus for this. I have a large procedure file for all my functions and macros, that creates a new menu to give me access to all the functions I routinely use for data analysis.
Here's an excerpt of what that looks like for me, to get you started.
That allows me keeping track and using a large number of functions and macros.
Incidentally, to deal with and group a large number of windows, which I also do frequently, I'm using custom routines that I posted a while ago (Nov 2018!) in this thread. Just in case that's also of interest.
September 1, 2020 at 07:41 pm - Permalink