Unexpected transformation of image


Hi all,
I imported the image 'test1.jpg' in Igor Pro using Data --> Load Waves --> Load Image. Then I did the following: Windows --> New --> Image Plot --> test1.jpg. The result is not expected - my image is rotated, namely it is mirrored (flipped), and the axes appeared. Why does Igor Pro do such transformation? I just want to load and depict my original image without any rotations and axes, and with the original resolution. Is there any opportunity to do this? Then I saved this flipped image as 'test2.jpg', using File --> Save Graphics --> JPEG File. The saved image 'test2.jpg' is very small, with bad resolution, and axes. Please find attached the original image 'test1.jpg' and the flipped image 'test2.jpg'.
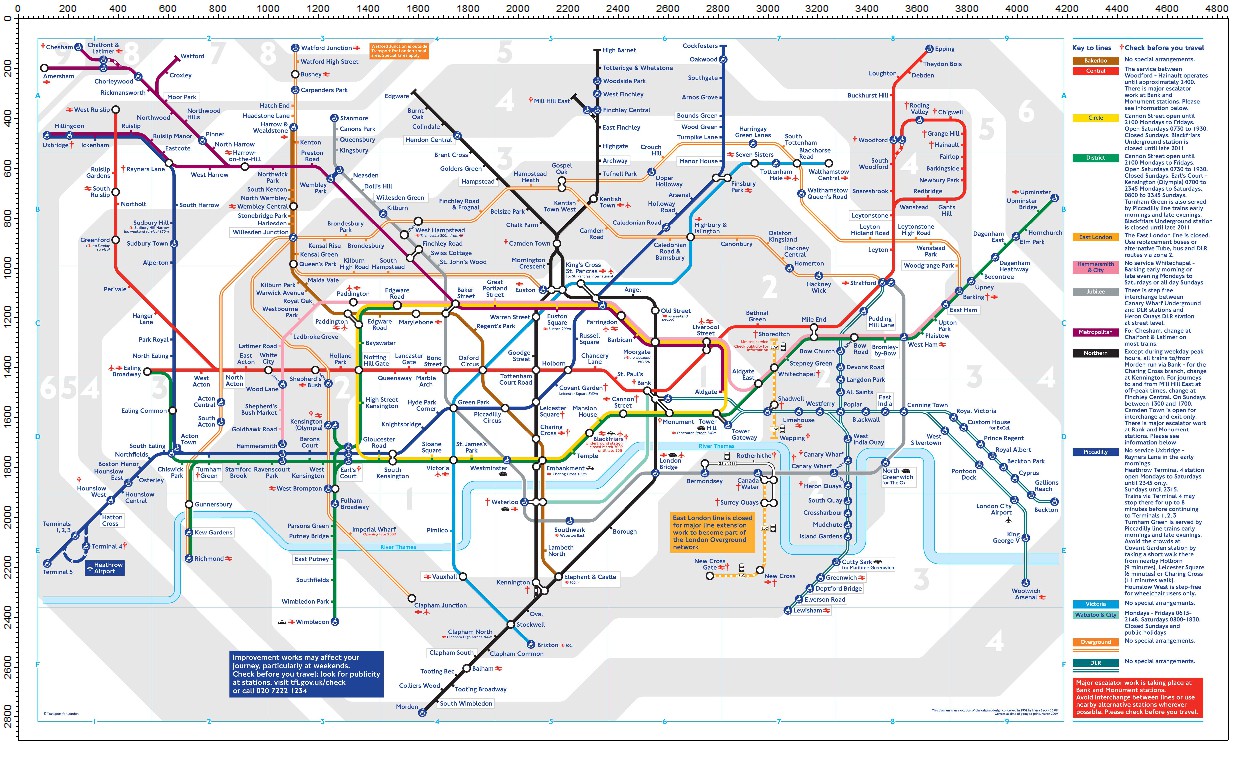
I also tried another option. When loading the image, I ticked 'Display Image', and it gave me my image in true orientation, without any rotation, but again with axes, although in another style. I saved this image as 'test3.jpg'. Its resolution is also bad. Please find attached 'test3.jpg'.
Could you please tell me, how can I solve these problems?
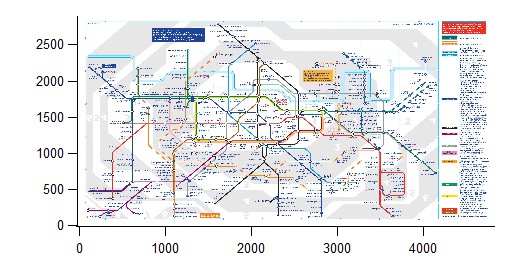
What I find interesting is in your second image that is flipped the y axis is not reversed. Typically when looking at images to get the expected orientation it is necessary to flip the y axis. Image coordinate systems do not follow right hand rules.
I did a quick test on my system running 8.03 and I get two different results with the Y axis. If I right click in the data browser and select I get the intended result. If I do your method I also get the flipped image. If I lower select "Use NewImage" checkbox in the upper left of the dialog panel I also get the intended result.
So I am guessing the difference is back on how to think about the coordinate system.
Andy
April 11, 2019 at 03:10 pm - Permalink
The command
is one way to display an image in a graph as an image plot. Another is
Both are intended as ways to display scientific data in a graph, but NewImage was designed to be more in line with standard image processing and the conventions used with images. NewImage also tries to size the graph window so that the image is displayed with one matrix cell per screen pixel, where AppendImage sizes the image to fit the existing graph window. But the notion that it is a scientific graph accounts for the axes in both cases.
If you really want just a picture, use Misc->Pictures, then Load->from Clipboard. Then you can place your picture in a draw layer in a graph, panel, or layout, or you can put it into a formatted notebook. You can also paste a picture directly into a draw layer or notebook, in which case the step of using the Pictures dialog is done for you behind the scenes. The dialog gives you a bit more control.
The resolution in your example is probably a result of loading a really big image that perhaps has too many pixels to fit conveniently on the screen.
If your goal is to print the underground map for use while traveling around the city, there may be more convenient programs than Igor :)
April 11, 2019 at 03:33 pm - Permalink
Thanks a lot for your answers!
Underground map is just test image :)
April 12, 2019 at 01:33 am - Permalink
In reply to The command Display… by johnweeks
tonyNote also the difference between
File - save graphics Saves a picture of the window as a graphics file (resolution can vary)
Data - Save Waves - Save Image Saves the image data in a graphics file format
April 12, 2019 at 01:51 am - Permalink
In reply to Note also the difference… by tony
Physicist92Thank you!
April 12, 2019 at 02:37 am - Permalink