Curve fitting in semilog graph


Hi all,
I have experimental nuclear magnetic resonance data that describe T2-relaxation of the nuclei in the sample of interest. The experimental points obey mono- or biexponential dependence: I = I0*exp(-t/T2) or I = I1*exp(-t/T2_1) + I2*exp(-t/T2_2). In the second case, I1 and I2 are intensities which represent fractions of two T2 components - T2_1 and T2_2. The purposes are 1) to determine whether the experimental points obey monoexponential dependence or biexponential dependence, and 2) to calculate T2 (in case of monoexponential behavior), T2_1 and T2_2 (in case of biexponential behavior). I fit the experimental data points with mono- and biexponential equations. In most cases (I have a number of experiments), both mono- and biexponential fits are good. In order to ensure that the experimental points have biexponential behavior and not monoexponential (or conversely), I use semilog graph. I take natural logarithm of intensity values, and thus the vertical axis in the graph is now in ln(I). Then I fit y = C - t/T2 to the entire data set, assuming that the data set is described only by one T2 value. Then I consider that the data set is described by two T2 components (T2_1 and T2_2). In obtained semilog graph, I need to divide points into two parts: first part of points will be fitted by linear equation y1 = C1 - t/T2_1, and the second part of points will be fitted by linear equation y2 = C2 - t/T2_2. And here I have two variants of how to do this fitting. The first variant is just to fit each part of data points with linear equation with corresponding initial guesses. And the second variant is the following: first, I fit the second part of points with equation y2 = C2 - t/T2_2, i.e., for example, 7 points as you can see in the attached pictures. Thus I found C2 and T2_2 from fit. Then, using equation y2 = C2 - t/T2_2, I find ln(I) values for time values corresponding to the first part of points (i.e., for example, first 3 points). After that, I subtract these extrapolated ln(I) values from first three experimental ln(I) values. Let's call these new values as ln(I)1, ln(I)2, ln(I)3. Finally, I fit these 3 points with equation y1 = C1 - t/T2_1 and find the parameters C1 and T2_1. Could you please tell me, which variant of calculating T2 values is true? Please find attached two pictures which show the difference between two mentioned methods of calculating T2 values.
To check the methodology, I generated test data (100 points, wave called Intensity). And then I applied two above mentioned methods of calculating T2 values. Please find attached Igor Pro experiment file with all generated data and graphs.
Graph0 - intensity vs time, and biexponential fit f(t) = I1*exp(-t/T2f)+I2*exp(-t/T2s)
Graph1 - ln(Intensity) vs time, and fit using equation f(t) = ln(I1*exp(-t/T2f)+I2*exp(-t/T2s))
Graph5 - ln(Intensity) vs time, and fit using linear equation for the entire data set: f(t) = C-t/T2
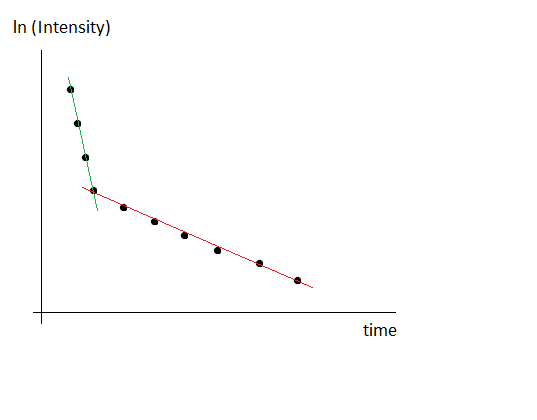
Graph2 - ln(Intensity) vs time, and fit of points 19 - 99 using linear equation f(t) = C-t/T2
Graph3 - ln(Intensity) vs time, and fit of points 0 - 8 using linear equation f(t) = C-t/T2 (I decided not to take data points 9 - 18 for fitting, since it is the transition area, in my opinion)
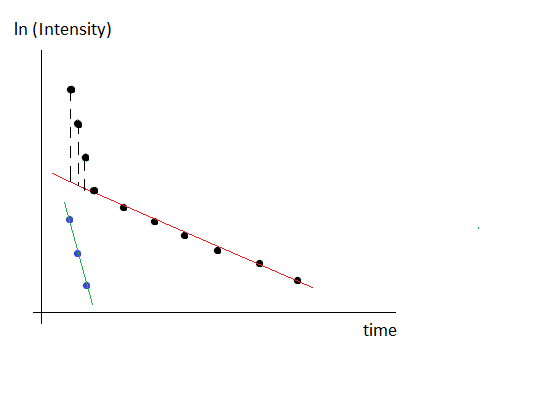
Graph4 - ln(Intensity) vs time, and fit of new points 0 - 8 (after subtraction) using linear equation f(t) = C-t/T2.
I understand that the question is about physics, not about Igor Pro, but I hope for your help.
Both methods of calculating T2 values in semilog graphs give T2_1 value that is not equal to 0.005 second which is set when generating test data. The first method (without any subtraction) gives approximately 0.00746 second, and the second method (with subtraction) gives approximately 0.012 second.
One person told me that I should use the second method (with subtraction) but I have doubt because this method gives T2 value that is far from true T2 value (from 0.005 second in this case).
I suspect that with real data, rather than a synthetic dataset, the first and second fit will not have the same fit coefficients. You have a set of measurements and you want to test models by determining which gives the better fit. In general it's best to fit the data, rather than propagating the data into logspace (and propagating associated measurement error). I would fit the intensity data, but display with a log axis. In the plot with a log axis the errors (if you were to plot them) appear asymmetric. Plotting intensity on a log scale and plotting log(intensity) look the same, but it's not the same thing! The log axis is necessary to show the biexponential form of the data, but if you can write a function that fits your data in measurement space that should be best.
In your synthetic dataset, try adding some noise (intensity +=gnoise(1)), then take the logarithm and compare the fits using your first and second methods. Compare w_sigma for the two fits....
If your question is whether the linear fits to selected data ranges give a valid result, you can answer that question (for your current dataset) by applying the appropriate transformation to the fit coefficients to compare with the coefficients that you used to generate the data.
May 15, 2019 at 02:33 am - Permalink
In reply to I suspect that with real… by tony
Physicist92Thank you!
May 15, 2019 at 02:07 pm - Permalink