Understanding chi square for weighted data


Hello everyone
I have a question regarding chi square, which is given after a fit.
I read here, in the forum, that a good fit is indicated by a chi square value that is not too far from the number of data points, in weighted data. In fact, for a good fit, chi square should be about the number of data points.
This is my question. What if after the fit the value of chi-square is smaller than the number of data points in a fit where the data are weighted? I have this situation where the fit looks good/perfect, and the value of chi-square is about 11 while the number of data point is 63. How to interpret this?
Attached is a picture of the fit
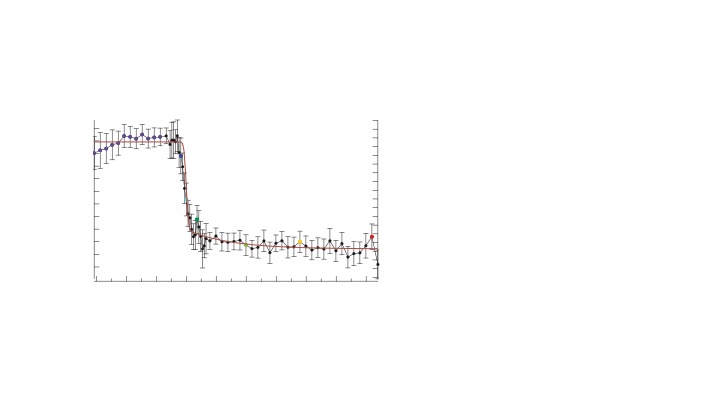
My understanding is that the weightings should be representative of the noise in the data. At first glance, it looks as though your error bars are quite large - if the error bars are supposed to represent +/- one st. dev. then one would expect roughly one third of the data points to lie outside the error bars. If you over estimate the size of the uncertainty (noise), then the 'normalisation' of Chi-Sq using such weightings will cause the chi-sq to be smaller than one would reasonably expect.
Here is an example to demonstrate the fitting and calculating the 'Reduced - Chi-Sq', which should be around 1 for a good fit, much greater than 1 for a poor fit, and much less than 1 for overfitting.
https://en.wikipedia.org/wiki/Reduced_chi-squared_statistic
May 13, 2022 at 08:02 am - Permalink
Are your error bars standard deviations of multiple samples? The weights should really be the standard error of the mean, that is STD/sqrt(N-1).
May 13, 2022 at 09:26 am - Permalink
> Are your error bars standard deviations of multiple samples? The weights should really be the standard error of the mean, that is STD/sqrt(N-1).
But ... IP 8 gives options for weightings using standard deviation not standard error of the mean? Has this changed in IP 9? Or am I misunderstanding something?
May 13, 2022 at 03:15 pm - Permalink
Hmmm... I see in the Curve Fitting help file this statement: "...where σi is the standard deviation for each data value"
I think I can wiggle out of this on the basis that the standard error IS the estimated standard deviation of the mean, and the data points in the case of averages of multiple measurements are the mean values. So using the standard deviation of the measurements is NOT the standard deviation of the value that's being used for fitting.
Jeff- how wiggly was that? :)
I find myself getting tied into linguistic knots when talking about statistical stuff. But I think this statement is actually not incorrect.
I think it's actually better to fit the original data rather than the averaged values. If the measurement are normally distributed and the fit function is linear, the two fits will be identical. If you violate either of those they may not be, and with all the raw data present, you can see problems like biases, non-constant variance, skewed residuals, etc.
May 13, 2022 at 04:03 pm - Permalink
Admittedly, one can get a bit lost wading among the terms uncertainty and error as well as average and mean as well as standard or not.
https://en.wikipedia.org/wiki/Standard_error
The Guide to Uncertainty in Measurement (GUM) is one of my go-to references.
https://www.bipm.org/documents/20126/2071204/JCGM_100_2008_E.pdf/cb0ef4…
More recently, I also draw on this book.
Measurements and Their Uncertainties, I G Hughs and T P A Hase (Oxford University Press, 2010).
I hold that error means a difference between any one measured value and the truth while uncertainty maps how errors are distributed in a set of measurements. I ground myself first at the infinite end with the terms mean (mu) and standard deviation (sigma). An infinite distribution has no need to invoke a standard error in the mean (SEM), ostensibly because the value would be identically zero. In a finite world, the terms that I use to represent the distribution become average <...> and standard uncertainty S. I use the term standard uncertainty of the mean S_M not standard error of the mean (although, if I was truly pedantic, I guess I may have to call the term standard uncertainty of the average).
I agree that curve fits should be to the entire set of data but sometimes these things are not done that way for various reasons -- good, bad, and ugly.
In any case, regardless of terminology, my question is simple: Based on how the algorithm for the curve fitting works in IP, should the weightings that are fed to curve fit be standard uncertainties / standard deviations (S or sigma) or should the weightings fed to the curve fit be the standard uncertainty (standard error) of the mean (S_M or SEM)?
If the weightings should be the S_M (SEM), I would ask to change the Curve Fit help and input dialogs on the Curve Fit panel to use the proper terms.
RATHER THAN
... where sigma is the standard deviation for each value.
USE
... where SEM is the standard error of the mean for each value.
I can appreciate that this distinction may not (will not???) matter *as long as all data points are derived from the same number of measurements N*. The difference between S and S_M across all weights cancels out. BUT, when some data points are from five measurements and other data points are only from three measurements, the distinction in weighting using S versus S_M matters at each data point.
Finally, I note that in Hughs and Hase, the discussion on weighted regression fitting suggests that weighting factors are typically taken as the inverse of the variances in the distribution. So, they suggest the weightings should be tied to S not to S_M.
May 13, 2022 at 09:12 pm - Permalink
In reply to Are your error bars standard… by johnweeks
Arnaud_PThe error bars (+/-) represent the standard error. Each data point is obtained by averaging/integrating the data over a certain interval, and the standard error is generated/calculated accordingly.
May 16, 2022 at 01:42 am - Permalink
In reply to Are your error bars standard… by johnweeks
Arnaud_PThe error bars (+/-) represent the standard error. Each data point is obtained by averaging/integrating the data over a certain interval, and the standard error is generated/calculated accordingly.
May 16, 2022 at 01:44 am - Permalink
In reply to Admittedly, one can get a… by jjweimer
Arnaud_PThank you so much JJ for your comments.
The data points shown in the image are actually the result of a bin, these come from the same dataset (2D dataset to be precise). I guess we all here know what bin is; otherwise, I can also specify that binning consist of averaging/integrating the data points over a defined interval. So, each of the data points (black closed markers) represents the mean of the data points in the considered range (interval).
My question is to understand the exact meaning of the chi-square that I get, with respect to this fit.
May 16, 2022 at 02:00 am - Permalink
In reply to My understanding is that the… by KurtB
Arnaud_PThanks KurtB for your comments.
All I can say at this point is that the error bars are the standard errors resulting from integrating over regular interval. I will try to look into why I have such a small chi-square value.
May 16, 2022 at 02:45 am - Permalink
In reply to jjweimer wrote: … by Arnaud_P
KurtBI have extended the demo a bit to try to illustrate what Igor actually calculates as ChiSquared.
which produces the following:
So you can see that the Chi-Squared reported from the fit function is the sum-square of the residuals divided by the weighting for each point.
For comparing different datasets that may have different numbers of points, and indeed assessing the goodness of the fit, in my experience it is usual to normalise Chi-Sq to the Reduced Chi Sq. This does require that the weightings used are a good estimation of the random noise in the data, and thus systematic deviations in the residuals can be attributed to the model not describing the empirical data in detail and will result in a Reduced Chi-Sq >>1.
Hope this helps!
May 16, 2022 at 03:11 am - Permalink
In reply to Arnaud_P wrote: stion is… by KurtB
Arnaud_PHi KurtB,
Yes, this explanation is indeed helpful.
Thanks
May 16, 2022 at 05:14 am - Permalink
Just to follow up. Should the input values for the weightings to a curve fit in Igor Pro be the standard uncertainties (standard deviations) or should they be the standard uncertainties of the mean? In case the terms are still confusing, as the number of measurements goes to infinity, the standard uncertainty goes to the standard deviation and the standard uncertainty of the mean goes to zero.
May 20, 2022 at 03:38 pm - Permalink
In reply to Just to follow up. Should… by jjweimer
KurtBI think that if you are fitting using the means of many bins then you should use the standard uncertainties of the mean as the weighting in the curve fit.
I have attempted to illustrate this in the following demo, where I have generated a load of data and cast this as both a set of binned and non-binned waves, and fitted both sets. No guarantee that this is strictly correct, but I think it is. I hope the code is sufficiently simple to be pretty much self-explanatory?
May 23, 2022 at 05:48 am - Permalink
Jeff- Sorry I didn't respond more quickly, things have been a bit hectic. My understanding is that the weight should be the standard deviation of whatever value you are fitting. If you have multiple points averaged, you have a more or less built-in estimate, which is the "standard error of the mean". If you have raw data, and are lucky enough to have some independent estimate of the standard deviation of your measurements, use that. If you have raw values and no idea of the actual measurement uncertainty, and the uncertainty is constant, and there are no systematic errors, and you have a good model, you are probably best off to fit the raw data without weighting as the residuals will estimate it better than a binning estimation.
Please note all the qualifications to my last statement!
May 23, 2022 at 12:30 pm - Permalink
John -- Thanks. Standard deviation (standard uncertainty) it is then.
May 24, 2022 at 06:05 am - Permalink