Axis not autoscaling


I have created a master interface for my users to review data. It is a grid of 9 graphs with individual left and bottom axis.
I have created a hook function such that when one of the graphs is expanded in the x axis (expand horizontal) from the pop menu all the graph bottom axis match and then intent is to autoscale the left axis to only the data seen.
Function SetXaxis()

	Variable Xmin, Xmax
	getaxis /Q Bvoc
	xmin=V_min
	Xmax=V_max
	getaxis/Q BJsc
	xmin = max(xmin,V_min)
	Xmax = min(xmax,V_max)
	getaxis/Q BFF
	xmin = max(xmin,V_min)
	Xmax = min(xmax,V_max)
	String AxisName ="Bvoc;Bjsc;Bff;Bvmax;Bpmax;Bimax;Brshunt;Brseries;Beff"
	Variable Index
	For(index=0;index<9;index+=1)
		setaxis $stringfromlist(index,AxisName) xmin,xmax
	endfor
	doupdate
	AxisName ="LVoc;Ljsc;LFF;Lvmax;Lpmax;Limax;Lrshunt;Lrseries;Leff"
	For(index=0;index<9;index+=1)
		setaxis/A=2/n=1 $stringfromlist(index,AxisName)
	endfor

End
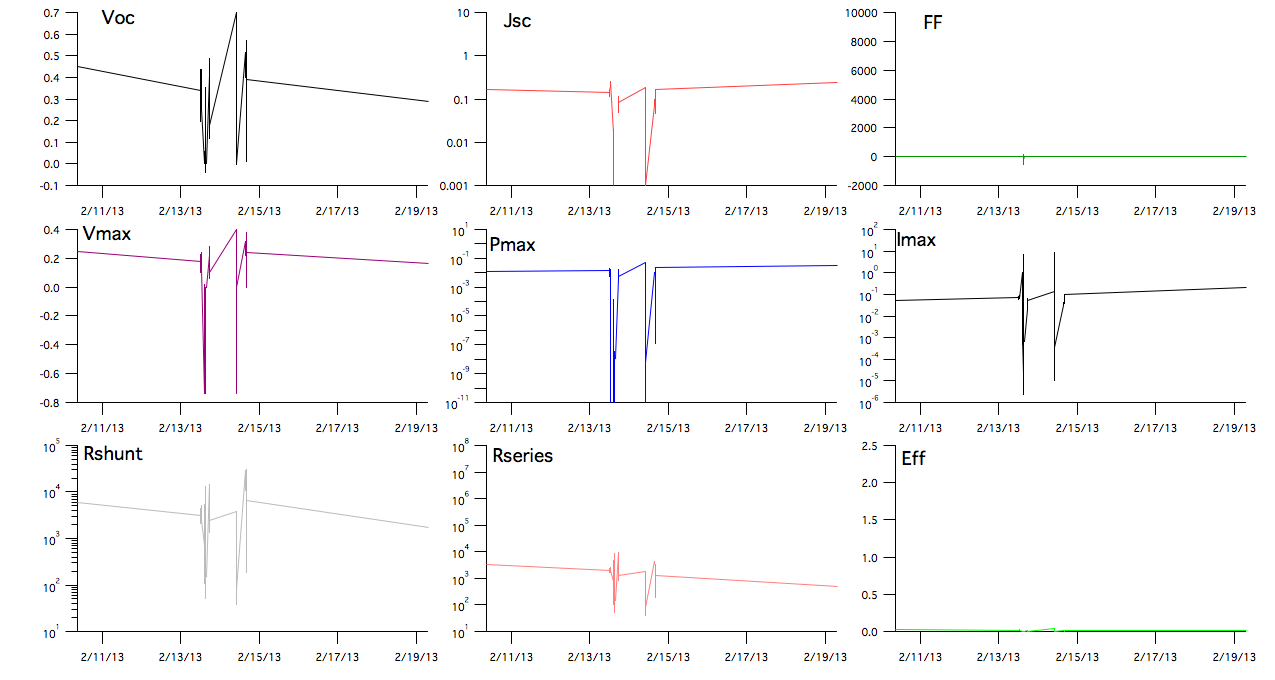
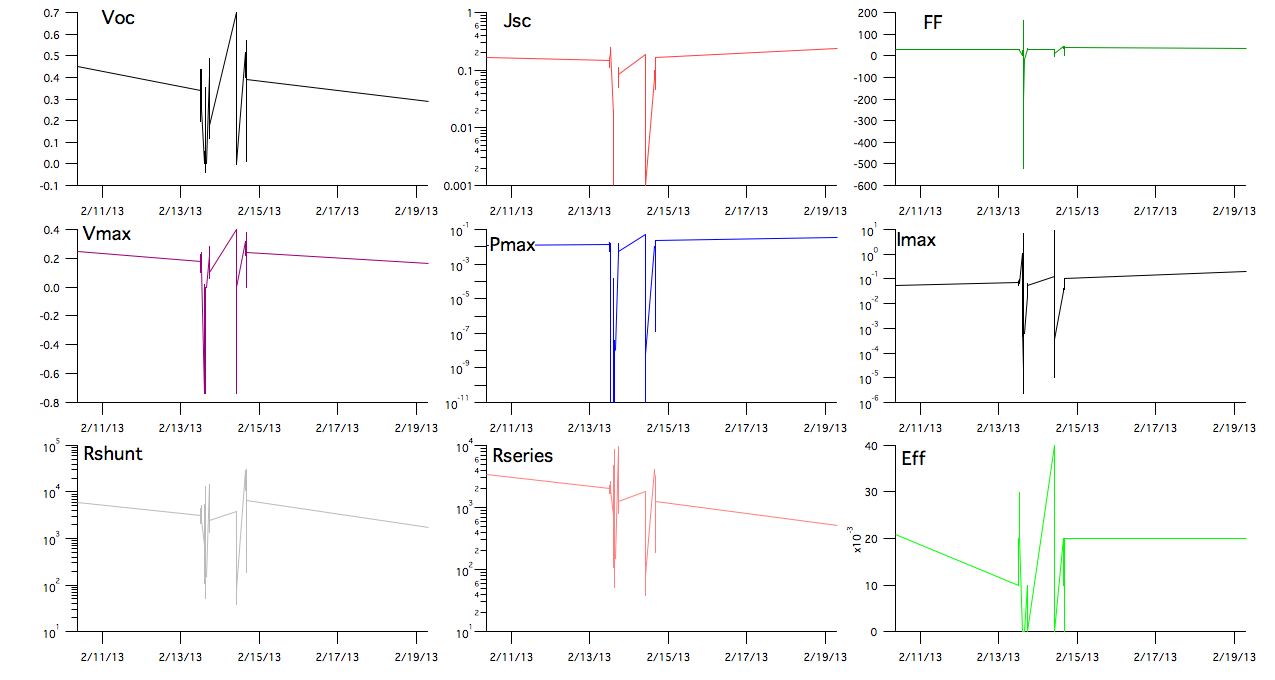
The problem is not all the left axis scale to the visible region. See Master1.png attached. Now the really odd thing If I double click on one of the offending left axis to bring up the modifyaxis dialog box and then hit "cancel". I have done nothing made no changes just hit "cancel" The left axis autoscale correctly. See master 2.png attached
Any clue as to what is going on and how do I fix my code to work correctly

I don't think this is the cause of the problem but your use of DoUpdate does not look right.
DoUpdate is needed before a command that requires that any previous changes to the graph be fully registered by Igor. This registration normally occurs in the outer loop when Igor updates any changed windows. DoUpdate is needed if your procedures might depend on something that is is pending registration. It forces an immediate update thereby causing the previous change to be fully accounted for internally.
For example, if you call ModifyGraph followed by GetAxis you need a DoUpdate before the GetAxis to ensure that the change requested by ModifyGraph has been fully registered.
In this case you probably don't need any DoUpdates but if you do, it would be before the first GetAxis.
As I said, I don't think that is the cause of your problem. To understand it I will need to do some debugging which requires a (preferrably) simplified experiment that illustrates the problem.
March 1, 2013 at 07:03 pm - Permalink
It works the same without it.
I am on MacOS 10.8 running version 6.30.
File is attached.
March 2, 2013 at 07:27 am - Permalink
To fix this you need to use Execute/P to call SetXAxis from your hook function. This posts it to the command queue and Igor executes it later in its outer loop, after the original graph modification is finished and the graph has been updated.
However calling SetXAxis from your hook using Execute/P also has a problem. Since SetXAxis modifies the graph, it triggers the hook again which modifies the graph which triggers the hook again...
To solve the problem I made these changes in the attached experiment:
1. Change the call to SetXAxis in HighlightDataPoint_Hook to call PossiblyExecuteSetXAxis.
2. Define a function HighlightDataPoint_Hook which calls SetXAxis via Execute/P but only if it was not called recently.
See the definition of HighlightDataPoint_Hook in the SeeAllPoints procedure file for details.
Update: I posted a different and probably better solution below.
March 2, 2013 at 12:24 pm - Permalink
See the function PossiblyPostSetXAxisCall in the SeeAllPoints procedure file for details.
March 2, 2013 at 06:40 pm - Permalink
March 4, 2013 at 05:31 am - Permalink
Thank you very much.
One question? If "autoscale visible data only" is set for the left axis of the graphs, would it be possible to set the range automatically of the other axis. For example if I select expand horizontally with a marquee the left axis would autoscale to visible data?
March 4, 2013 at 07:34 am - Permalink
Sounds like a good solution and simpler than what I came up with. I have implemented it in the attached. See the PostSetXAxisCall function.
March 4, 2013 at 08:43 am - Permalink