ColorScales for Gizmo scatter plots


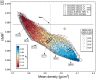
I ran into a problem regarding ColorScales with Gizmo: I have chemical data from inclusion measurements, which I like to plot in ternary diagrams as shown in Fig. 1 for Al,Ca and S (=SW). The color of the data points corresponds to the inclusion size on a log-scale and is set using the "ModifyGraph zColor" operation. The log-size data are therefore stored in a 1D wave.
Fig. 2 is a plot of the same data set including Mg as fourth component in a quaternary diagram. I'd like to set the color scale according to the ternary diagram, thus log-size as color of the data points. If i didn't miss anything in the Gizmo documentation, I need to set up a 4-column 2D wave, containing r,g,b,a values running from 0 to 1. The question is now: How do I translate my log-size data into such a scheme which is identical with the color scale I applied in the ternary (in this case it's Rainbow16)?
Any ideas are welcome!
Regards
Christian
 and Fig 2 (right)")
I can't determine what method you used to choose your colors in the ternary diagram. In general, when trying to match or use colors from the built-in color tables you would use ColorTab2Wave. This creates the wave M_colors which you can then use with any scaling you need. For example, suppose you have a 1D wave (say wave1) containing a scalar value that you would want to plot using any scaling function e.g., myFunc(inX). What you could do is:
Duplicate/O wave1,scaledWave
scaledWave=myFunc(wave1)
// Now get the min and max values:
Variable theMin=WaveMin(scaledWave)
Variable theMax=WaveMax(scaledWave)
Variable nor=(DimSize(M_colors,0)-1)/(theMax-theMin)
MatrixOP/O scaledWave=nor*(scaledWave-theMin)
M_colors/=65535
// To create a color wave for a scatter in Gizmo:
Make/O/N=(numRows,4) colorWave=1 // alpha will be 1.
colorWave[][0]= M_colors[scaledWave[p]][0]
colorWave[][1]= M_colors[scaledWave[p]][1]
colorWave[][2]= M_colors[scaledWave[p]][2]
I hope this helps,
A.G.
WaveMetrics, Inc.
May 18, 2009 at 11:47 am - Permalink
Assuming the data for the graph are data stored in the waves Y_transformed and X_transformed, and the size data in log_area, I would execute
display Y_transformed vs X_transformed
ModifyGraph mode=3, marker=19 //Set the marker
ModifyGraph zColor(Y_Transformed)={log_area,*,*,Rainbow16,1} //Set the color
..thanks a lot! This is exactly what I was looking for!
Regrads
Christian
May 18, 2009 at 09:56 pm - Permalink