Creating Box Plots Based on labels from a text wave


Hi,
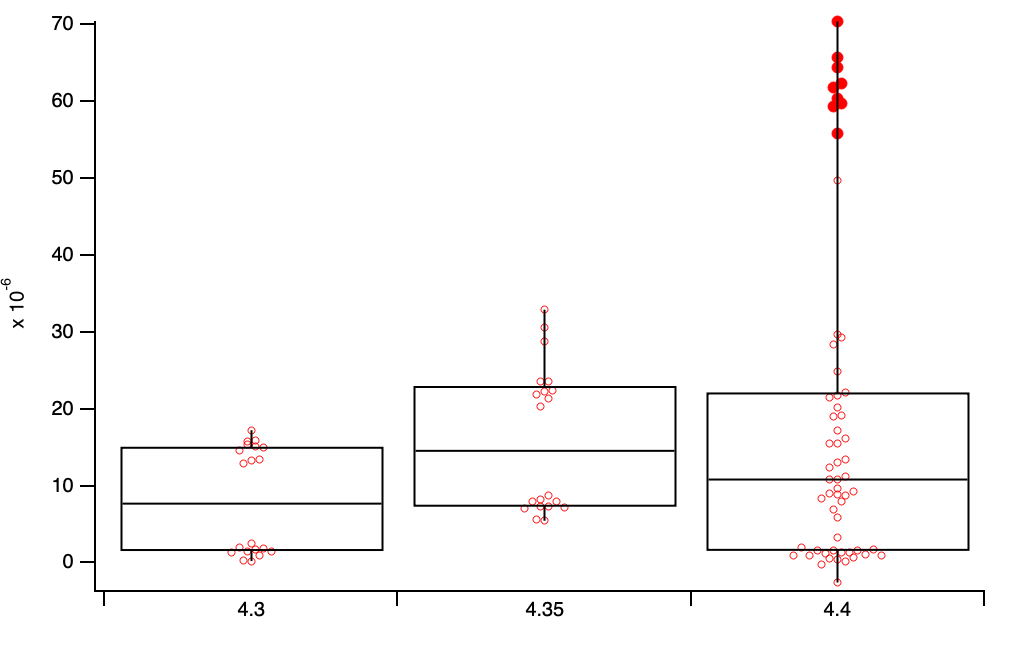
Just sharing a simple bit of code to assist in creating box plots. My workflow often includes data with both text designations, such as label with sample ID, and numeric data such as measurement. In trying to keep thing organized I often have a extended text wave with the IDs and repeated measurements in the data wave and a need to create a box plot with labels from the box plot.
The second workflow I often find myself doing if I am looping over several input files is to create a 2D wave with the results and then take advantage of row labels to store the ID of the sample. This since I often need to export data for use in other programs and the row labels allows me to keep arrangement of the data for export without needing to create a table.
The first takes a numeric and text wave and the second takes a 2D wave along with a a data column, and either a second column as labels or the use of row columns. Note the label column is meant to take a numeric value and convert it to text for labeling purposes. My use case is that the column may have temperature set points for example and I want to create a box plot with the temperatures as labels. I have added a little experiment with some data. After the graph is created you can modify the exact label by changing the column dimension labels of the resulting 2D wave.
Enjoy and improve.
Andy
Function NewBox(Inwave,LabelWave)
	wave Inwave
	wave/t labelwave

	//get then labels
	Findduplicates/FREE /RT=textlabels Labelwave
	sort /A=1 textlabels, textlabels
	variable index,maxindex,points,maxpoints
	maxindex= numpnts(textLabels)

	String BoxMatrixName
	if(wavetype(Inwave,2)==2)
		BoxmatrixName = "Generic"
	else
		boxMatrixName =nameOfWave(inWave)+"_box"
	endif
	Make/O /n=(numpnts(Inwave),maxindex) $BoxMatrixName
	Wave results = $BoxMatrixName
	results =NaN
	For(index=0;index<maxindex;index+=1)
		SetDimLabel 1,index,$textlabels[index],results
		extract/FREE inWave, tempwave, !cmpstr(labelwave,textlabels[index])
		points = numpnts(tempwave)-1
		results[0,points][index]=tempwave[p]
		maxpoints = max(maxpoints,points)
	endfor
	redimension /N=(maxpoints,-1) results
	Display/k=1;AppendBoxPlot/CATL results
end


Function NewBox_Matrix(MWave,DataCol,LabelCol)
	Wave MWave
	String DataCol, LabelCol

	//define the numeric data for the box plot
	Variable Datacolnum = FindDimLabel(MWave, 1, Datacol )
	Matrixop/FREE datawave=col(Mwave,datacolnum)
	Variable i, therow, maxrow
	maxrow = dimsize(mwave,0)
	Make/FREE/T /N=(maxrow) labelwave

	if (stringmatch(LabelCol,"_label_"))
		labelwave[]=getdimlabel(Mwave,0,p)
	else
		labelwave[] = num2str(Mwave[p][%$LabelCol])
	endif
	NewBox(datawave,labelwave)

End