FFT failed


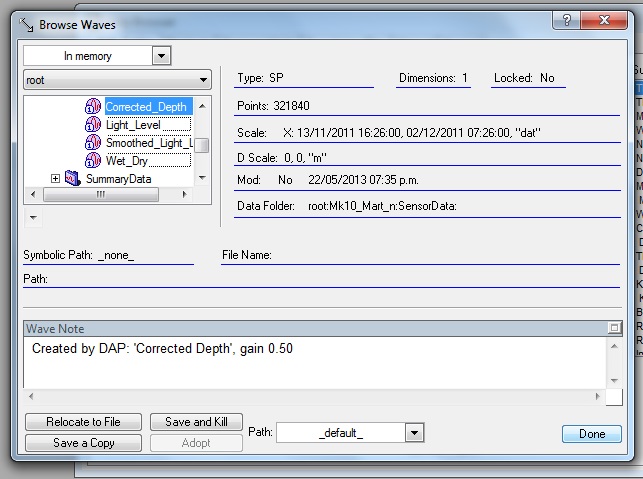
I performed an FFT with an original wave (details attached) to obtained the magnitude of the spectral component against the frequency. The original depth data points were taken at each 5 seconds with a PAT tag and then the wave was created with a DAP (Wlidlife Computers). The FFT graph obtained (output: magnitude) is also attached.
I do not know what i am doing wrong or missing to perform it well.
Thank you for your help.
All best,
Martín

The most common error in using the FFT operation is not setting the appropriate wave scaling and wave units. It appears from your Browse Waves dialog that your wave has units of date. This should be changed to 's' (for seconds) and your wave scaling should be set to dx of 5. To do that execute:
Obviously, the commands above use "mySourceWave" as a general place holder which you should replace with the name of your wave.
A.G.
WaveMetrics, Inc.
June 5, 2013 at 04:08 pm - Permalink
All the best,
Martin
June 6, 2013 at 07:31 pm - Permalink
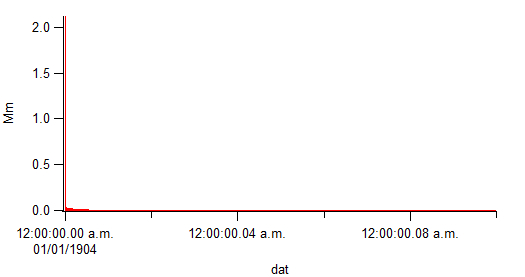
I tried to execute a FFT to the wave Corrected_Depth (with and without windowing) but in both cases the wave displayed is empty. How can I get a final graph with of the Relative magnitude of spectral component vs. Frequency cycles per day?. Please find the file attached.
Thanks.
All best,
Martín
February 19, 2014 at 04:19 pm - Permalink
In cases like this it is best to send a copy of the experiment to support@wavemetrics.com. Without further information my guess is that you have one or more NaNs in your input wave. NaN values at the input would give rise to an output wave where all the points are NaN.
A.G.
WaveMetrics, Inc.
February 19, 2014 at 04:51 pm - Permalink
It helpful to attach the experiment file, rather than only a screen capture.
--Jim Prouty
Software Engineer, WaveMetrics, Inc.
February 19, 2014 at 06:09 pm - Permalink
Regards,
Martín
February 20, 2014 at 06:12 am - Permalink
NaN is an abbreviation of "Not-a-Number", and is shown as a blank in a table.
This outcome is just the result of simple math: each output value of the FFT is affected by each input value, and NaN added to or multiplied with any number is NaN.
You need to remove the NaNs from the input data before computing the FFT.
And you have 116479 of them, beginning with point 365269.
I removed the junk at the end with:
because data after that point was either 0 or NaN.
I then ran WaveStats to check V_numNaNs, and got 0.
But the FFT needs an even number of points, to I removed one more (zero-valued, as it turned out) point with:
The FFT of a series is heavily affected by a large constant offset, so the offset should be removed first:
An FFT result is more sensible if the start of the X scaling is zero rather than a date:
Then the FFT magnitude can be computed with:
Horizontally expanding the result looks like the attached graph image. (I must leave interpretation of this up to you scientists)
--Jim Prouty
Software Engineer, WaveMetrics, Inc.
February 20, 2014 at 12:18 pm - Permalink