Forcing a square image in graph window (dendrogram + matrix)


I am using the Hierarchical Clustering functions in IP9 to generate a heatmap and dendrogram. In my current project, I have a 12 x 12 heatmap and am using vertical display of the dendrogram. I would like to force the heatmap to be square, i.e. each tile is square. Does anyone have any pointers for how to do this?
I know how to do it for a simple graph window which only contains an image, but here the dendrogram is drawn in the top margin and this (I think) means that my go-to trick of forcing the width aspect to be 1 * height doesn't work.
As I was about to hit "Post Topic", I tried:
ModifyGraph width=0,height={Plan,1,left,bottom}
...and it worked. Classic example of asking a question solves the problem. I am posting this as a solution in case anyone runs into this issue in the future.
Great! That is exactly what I would have recommended.
As the author of the Hierarchical Clustering and Dendrogram package, which I wrote with no actual experience using such analysis tools, I would be interested in any comments. If you are able to share your graph, that would be terrific, too.
April 5, 2023 at 09:27 am - Permalink
Thanks John. The package is very easy to use. We did correspond a little bit when you were writing it. In this example, I come out of an analysis in R to go to Igor to make this plot rather than doing the clustering and tree creation in R.
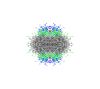
I am attaching my (square) plot. I have scrubbed the labels so as not to reveal the result. I'm using the Inferno Matplotlib colortable for visualization of the heatmap. The dissimilarity matrix is computed in Igor using quite a long routine (I don't use the package for this because the way the data is structured is not very compatible). The final part of my code interacts with your package to compute the dendrogram and draw the graph (code below if anyone is interested).
April 5, 2023 at 11:42 am - Permalink