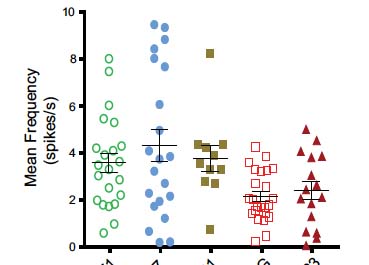
My solution to this is: for each wave (column), duplicate, set all points to 1 (or 2, 3 etc. for different columns) then add gnoise to jitter the points and then plot each y-wave versus the corresponding new wave. These wave pairs can be added to a graph generated with the Tukey box plot generator.
I would be interested in other solutions to this. Adding noise to your 'x-wave' means that you're unlikely to get any overlapping points, however, other graph packages do this in a symmetrical way and it would be good to do this in Igor if anybody knows how.
sjr51 wrote: My solution to this is: for each wave (column), duplicate, set all points to 1 (or 2, 3 etc. for different columns) then add gnoise to jitter the points and then plot each y-wave versus the corresponding new wave. These wave pairs can be added to a graph generated with the Tukey box plot generator.
I would be interested in other solutions to this. Adding noise to your 'x-wave' means that you're unlikely to get any overlapping points, however, other graph packages do this in a symmetrical way and it would be good to do this in Igor if anybody knows how.
I'm not sure what you mean by symmetrical. Also, I would have used enoise rather than gnoise to jitter the points horizontally, as gnoise can get arbitrarily large.
If the important thing is to separate overlapping data points, you can take the fractional part of integer multiples of an irrational number for your x data. The golden ratio works particularly well as the irrational number. Note that you want to sort the y data to bring out the benefits of the structure in the x data. Alternatively to sorting the y data, you can generate the x data with the index that each y data point would have had if the y data were sorted:
Variable center=3, half_width=0.3
Duplicate y_wave, y_index, x_index, x_wave
MakeIndex y_wave y_index // there should be a flag in MakeIndex to generate the inverse permutation directly
MakeIndex y_index x_index // but using MakeIndex on the index gives the desired result
x_wave = center + half_width*(mod((x_index+1)*(1+sqrt(5)),2)-1)
AppendToGraph y_wave vs x_wave
ModifyGraph mode(y_wave)=3,marker(y_wave)=19
If you really want a gaussian or some other distribution for the horizontal jitter, you can use the cumulative distribution as a look-up table to convert this x_wave to that distribution.


I would be interested in other solutions to this. Adding noise to your 'x-wave' means that you're unlikely to get any overlapping points, however, other graph packages do this in a symmetrical way and it would be good to do this in Igor if anybody knows how.
June 19, 2013 at 11:32 pm - Permalink
I'm not sure what you mean by symmetrical. Also, I would have used enoise rather than gnoise to jitter the points horizontally, as gnoise can get arbitrarily large.
If the important thing is to separate overlapping data points, you can take the fractional part of integer multiples of an irrational number for your x data. The golden ratio works particularly well as the irrational number. Note that you want to sort the y data to bring out the benefits of the structure in the x data. Alternatively to sorting the y data, you can generate the x data with the index that each y data point would have had if the y data were sorted:
If you really want a gaussian or some other distribution for the horizontal jitter, you can use the cumulative distribution as a look-up table to convert this x_wave to that distribution.
June 20, 2013 at 05:14 am - Permalink
Nate Hyde
WaveMetrics
Nate Hyde
June 20, 2013 at 01:43 pm - Permalink