Help needed in construction of subpanels

Hi all

I'm trying to construct a panel layout that nicely scales as the window is resized.

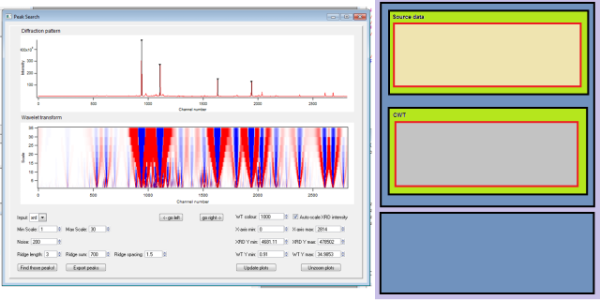
I've attached an image of what I currently have from hacking away at the CWT demo, and a layout of what I think I want.

I've written up this code so far, but the placement of the panels in which I want to place the plots doesn't seem to work; no notice seems to be being taken of my frameguides.

What am I doing wrong?

//---------------------------------------------------------------------------

Function BuildTestPanel()

    //parent panel
    DoWindow/F TestPanel
    if(V_Flag==1)
        return 0
    endif
    NewPanel /K=1 /W=(6,44,600,800) as "Test Panel"
    DoWindow/C TestPanel
    SetDrawLayer UserBack


    //panel to hold controls
    DefineGuide cpL={FL,5},cpR={FR,-5},cpB={FB,-5},cpT={cpB,-200}
    NewPanel /FG=(cpL,cpT,cpR,cpB) /N=controls /HOST=TestPanel
    DrawText 10,25,"Controls go here:"
    SetActiveSubwindow TestPanel
   
    //panel to holds graphs
    DefineGuide grL={cpL,0},grR={cpR,0},grB={cpT,-5},grT={FT,-5}
    NewPanel /FG=(grL,grT,grR,grB) /N=graphs /HOST=TestPanel
    SetActiveSubwindow TestPanel
   
        //panel to hold XRD plot
        DefineGuide xrdL={FL,5},xrdR={FR,-5},xrdT={FT,-5},xrdB={xrdT,-50}
        NewPanel /FG=(xrdL,xrdT,xrdR,xrdB) /N=xrdplot /HOST=TestPanel#graphs
        DrawText 10,25,"Diffraction pattern"
        SetActiveSubwindow TestPanel
       
        //panel to hold CWT plot
        DefineGuide cwtL={FL,5},cwtR={FR,-5},cwtB={FB,-5},cwtT={cwtB,-50}
        NewPanel /FG=(cwtL,cwtT,cwtR,cwtB)  /N=cwtplot /HOST=TestPanel#graphs
        DrawText 10,25,"Wavelet transform"
        SetActiveSubwindow TestPanel
   
end


The parent panel is 600x800
Any resizing of the width of the parent panel must result in the same change in all subpanels
Any resizing of height is specified below.

The bottom blue panel is 100% wide* and a fixed 200 pixels high. I've fixed it to the bottom of the parent panel. This is where I'm going to put all of my controls
The top blue panel is 100% wide, and the bottom of this panel is fixed to the top of the bottom blue panel. The top blue panel will change height, with the bottom blue panel remaining 200 pixels upon any resizing vertically

The two green panels are 100% wide and 50% high.

The red outlines in the green panels represent the plots.
The plots are 100% wide, and ~30 pixels less than the panel height, to allow for panel text.


* with 5 pixel setback all around
I swear the the best way to find the answer yourself is to ask for help. It then jumps off the page at you!

I was focussed on the wrong panels.

This is what I've got:

Function BuildPeakPanel()

    NVAR startScale  =root:Packages:PeakPanelFolder:startScale
    NVAR endScale    =root:Packages:PeakPanelFolder:endScale
    NVAR noise       =root:Packages:PeakPanelFolder:cwtNoise
    NVAR ridgeLength =root:Packages:PeakPanelFolder:ridgeLength
    NVAR ridgeSum    =root:Packages:PeakPanelFolder:ridgeSum
    NVAR delta       =root:Packages:PeakPanelFolder:delta
    NVAR cwtColour   =root:Packages:PeakPanelFolder:cwtColour

    NVAR xAxisMin    =root:Packages:PeakPanelFolder:xAxisMin
    NVAR xAxisMax    =root:Packages:PeakPanelFolder:xAxisMax
    NVAR xrdYAxisMin =root:Packages:PeakPanelFolder:xrdYAxisMin
    NVAR xrdYAxisMax =root:Packages:PeakPanelFolder:xrdYAxisMax
    NVAR cwtYAxisMin =root:Packages:PeakPanelFolder:cwtYAxisMin
    NVAR cwtYAxisMax =root:Packages:PeakPanelFolder:cwtYAxisMax
   
    NVAR initial_xAxisMin    =root:Packages:PeakPanelFolder:initial_xAxisMin
    NVAR initial_xAxisMax    =root:Packages:PeakPanelFolder:initial_xAxisMax
    NVAR initial_xrdYAxisMin =root:Packages:PeakPanelFolder:initial_xrdYAxisMin
    NVAR initial_xrdYAxisMax =root:Packages:PeakPanelFolder:initial_xrdYAxisMax
    NVAR initial_cwtYAxisMin =root:Packages:PeakPanelFolder:initial_cwtYAxisMin
    NVAR initial_cwtYAxisMax =root:Packages:PeakPanelFolder:initial_cwtYAxisMax

    //parent panel
    DoWindow/F PeakPanel
    if(V_Flag==1)
        return 0
    endif
    NewPanel /K=1 /W=(6,44,880,800) as "Peak Search"
    DoWindow/C PeakPanel
    SetDrawLayer UserBack


    //panel to hold controls
    SetActiveSubwindow PeakPanel
    DefineGuide cpL={FL,5},cpR={FR,-5},cpB={FB,-5},cpT={cpB,-170}
    NewPanel /FG=(cpL,cpT,cpR,cpB) /N=controls /HOST=PeakPanel
   
    //panel to holds graphs
    SetActiveSubwindow PeakPanel
    DefineGuide grL={cpL,0},grR={cpR,0},grB={cpT,-5},grT={FT,-5}
    NewPanel /FG=(grL,grT,grR,grB) /N=graphs /HOST=PeakPanel
   
        //panel to hold XRD plot
        SetActiveSubwindow PeakPanel#graphs
        DefineGuide xrdL={FL,5},xrdR={FR,-5},xrdT={FT,-5},xrdB={FT,0.5,FB}
        NewPanel /FG=(xrdL,xrdT,xrdR,xrdB) /N=xrdPanel /HOST=PeakPanel#graphs
        DrawText 10,25,"Diffraction pattern"
       
        //panel to hold CWT plot
        SetActiveSubwindow PeakPanel#graphs
        DefineGuide cwtL={FL,5},cwtR={FR,-5},cwtB={FB,-5},cwtT={FT,0.5,FB}
        NewPanel /FG=(cwtL,cwtT,cwtR,cwtB)  /N=cwtPanel /HOST=PeakPanel#graphs
        DrawText 10,25,"Wavelet transform"
       
   
    //let'a make the plots!
    //XRD plot
    SetActiveSubwindow PeakPanel#graphs#xrdPanel
    DefineGuide plotL={FL,10},plotR={FR,-10},plotT={FT,30},plotB={FB,-10}
    Display /FG=(plotL,plotT,plotR,plotB) /N=xrdPlot /HOST=PeakPanel#graphs#xrdPanel  xrd
    AppendToGraph w_peakPositionIntensities vs w_peakPositions
    ModifyGraph mode(w_peakPositionIntensities)=8
    ModifyGraph marker(w_peakPositionIntensities)=22
    ModifyGraph toMode(w_peakPositionIntensities)=1
    ModifyGraph rgb(w_peakPositionIntensities)=(0,0,0) 
    Label left "Intensity"
    Label bottom "Channel number"
        DoUpdate
        GetAxis /Q bottom
            xAxisMin = V_min
            xAxisMax = V_max
            initial_xAxisMin = V_min
            initial_xAxisMax = V_max
        GetAxis /Q left
            xrdYAxisMin = V_min
            xrdYAxisMax = V_max
            initial_xrdYAxisMin = V_min
            initial_xrdYAxisMax = V_max


    //CWT plot
    SetActiveSubwindow PeakPanel#graphs#cwtPanel
    DefineGuide plotL={FL,10},plotR={FR,-10},plotT={FT,30},plotB={FB,-10}
    Display /FG=(plotL,plotT,plotR,plotB) /N=cwtPlot /HOST=PeakPanel#graphs#cwtPanel
    AppendImage M_CWT vs {*,scalingWaveDisplay}
    ModifyImage M_CWT ctab= {-cwtColour,cwtColour,RedWhiteBlue,0}
    AppendImage w_peaks vs {*,scalingWaveDisplay}
    Label left "Scale"
    Label bottom "Channel number"
    ModifyGraph mirror=2
        doUpdate
        GetAxis /Q left
            cwtYAxisMin = V_min
            cwtYAxisMax = V_max
            initial_cwtYAxisMin = V_min
            initial_cwtYAxisMax = V_max


//and then a whole bunch of control inputs
So true about finding an answer by posting. Did that this morning! Deleted the post when I found the (totally obvious) solution.
I recommend that you execute the following on Igor's command line:
DisplayHelpTopic "Resize Controls Panel"


In case you don't already know, there's a package that ships with Igor that can be used to handle the resizing and repositioning of controls for you. It might be easier to use this package instead of doing the resizing yourself.
Ta for that aclight.

I'll have a read in my copious spare time!

Sounds like it should help a fair bit in the next stage of the process. I'll probably have a look at your tab control thing too.
I like that!

I didn't delete my post as I thought it might help someone else. I also got to learn about the resize commands; just about to read up on them now.