Hough Transform back to original image


Hi,
I am working on identifying lines in an image. The work flow thus far:
1. Bring in png image and convert it to gray scale.
2. Perform particle analysis to get the major features which are basically rectangles of varying length but the same width that may or may not overlap one another.
3. Use the M_particle wave from particle analysis as input into matrixfilter thin to create a skeleton.
4. Apply the image transform hough on the skeleton image.
What I want to do now is use the hot spots in the hough transform to impose the line back onto the skeleton image. To get the line I use the code from the IP Tutorial (any you thought no-one read the manual -HA!).
Function drawHoughLine(rad,angle)
	Variable rad,angle

	wave/z yy
	if(WaveExists(yy)==0)
		Make/O/N=2 xx,yy
		xx=nan
		yy=nan
		AppendToGraph/W=Graph0 yy vs xx
	endif
	ModifyGraph/W=Graph0  lsize=2

	if(angle==0 || angle==360)
		xx=50+(rad-70)*50/70
		yy={0,99}
	elseif(angle==90 || angle==180)
		yy=50+(rad-70)*50/70
		xx={0,99}
	else
		Variable i
		xx={-50,49}
		yy=50+((rad-70)*50/70-xx*cos(pi*angle/180))/sin(pi*angle/180)
		xx+=50
	endif
End
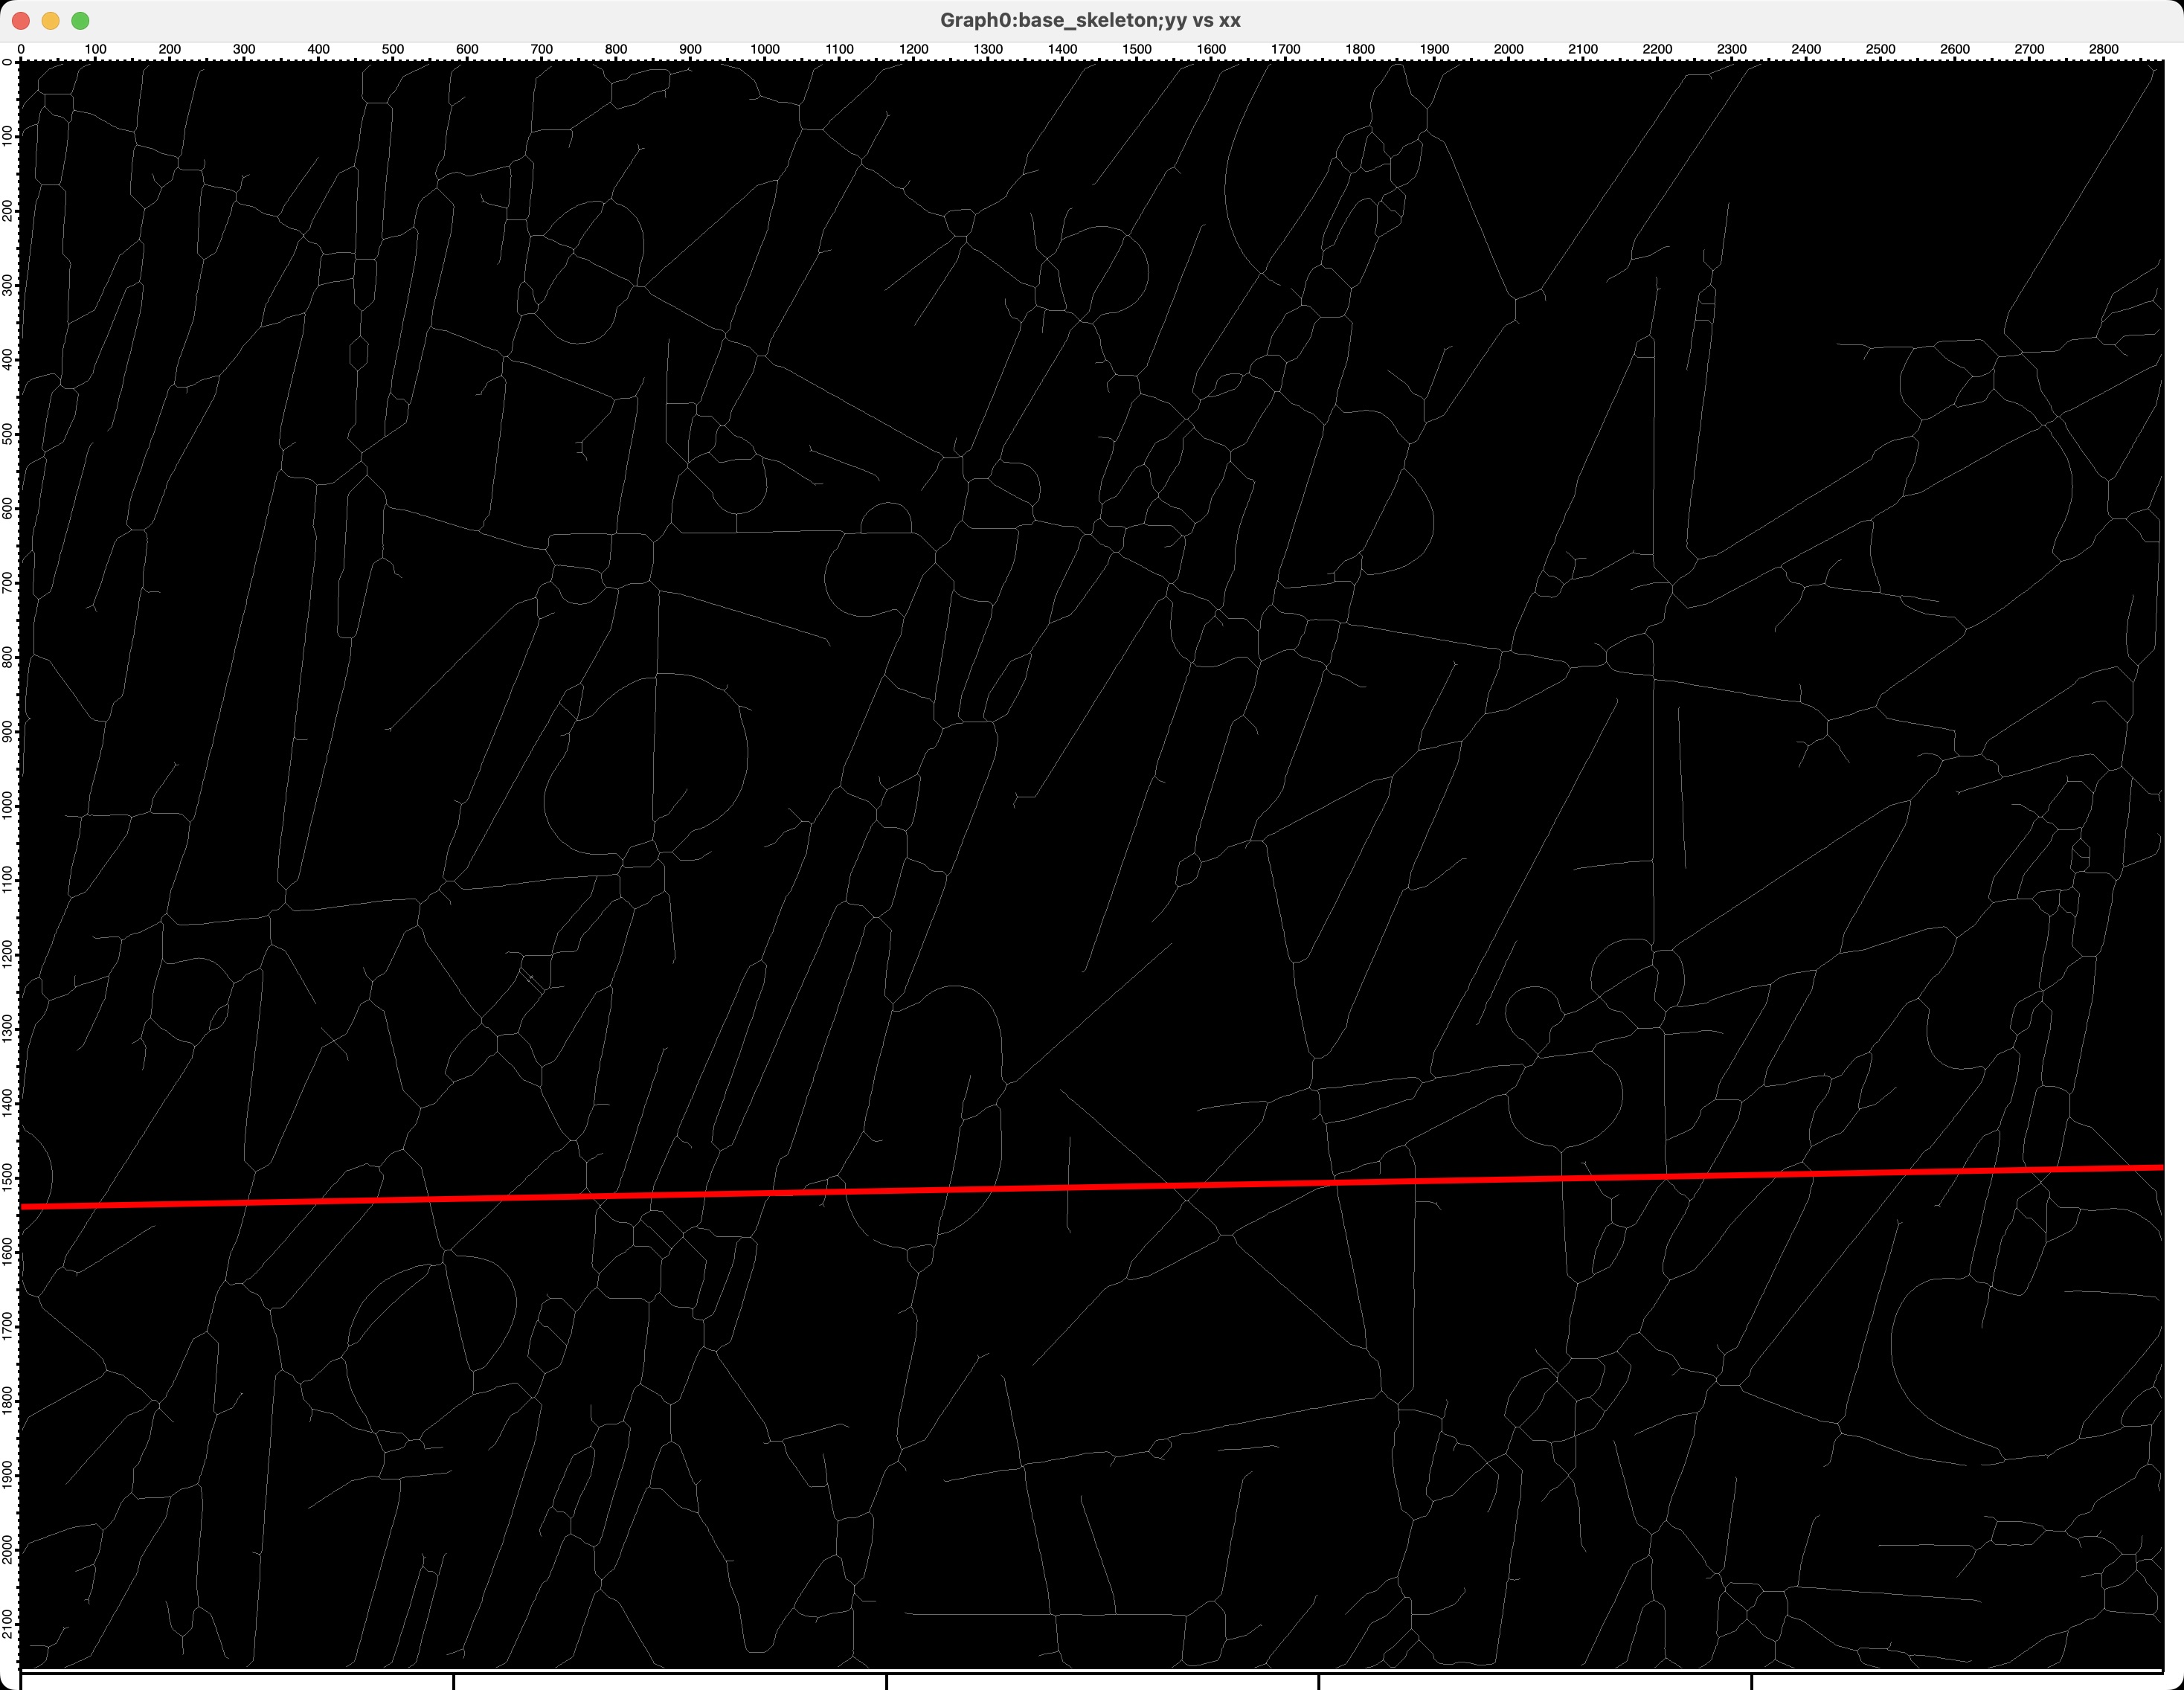
So I put th cursor on a hot spot in the hough image and run
drawhoughLine(hcsr(a),vcsr(a))
And low and behold it draws a line on the skeleton image, but in no way does it seem to line up with any of the points in the skeleton image.
What is amiss?
I have attached a basic experiment with the skeleton and hough images and the drawhoughline code.
Andy
First, I have no idea about Hough transformation. But the tutorial, including the drawHoughLine() function, is tailored to the specific example of an 100x100 image. See the manual:
So in the drawHoughLine() function above the radius is re-centered by 70, which is correct for the IPtutorial example but wrong for your enormous image. Another issue is that your image is not square, and it is difficult to figure out the center in the equation (which was 50 in the tutorial). I tried to adapt drawHoughLine() for about an hour, but didn't succeed (there was always some offset; maybe I have another look later). So, I am afraid you need to rethink the function from scratch using the correct center points of both your input and the transformation matrix.
June 23, 2025 at 05:51 pm - Permalink
After two more coffee, I figured out a general form:
Run via:
June 23, 2025 at 09:02 pm - Permalink
Hi Chozo,
Thank you very much. Perfect!
Andy
June 24, 2025 at 08:31 am - Permalink