How Fit with a cubic polynomial


I would make a fitting of my curve, to flatten my curve.
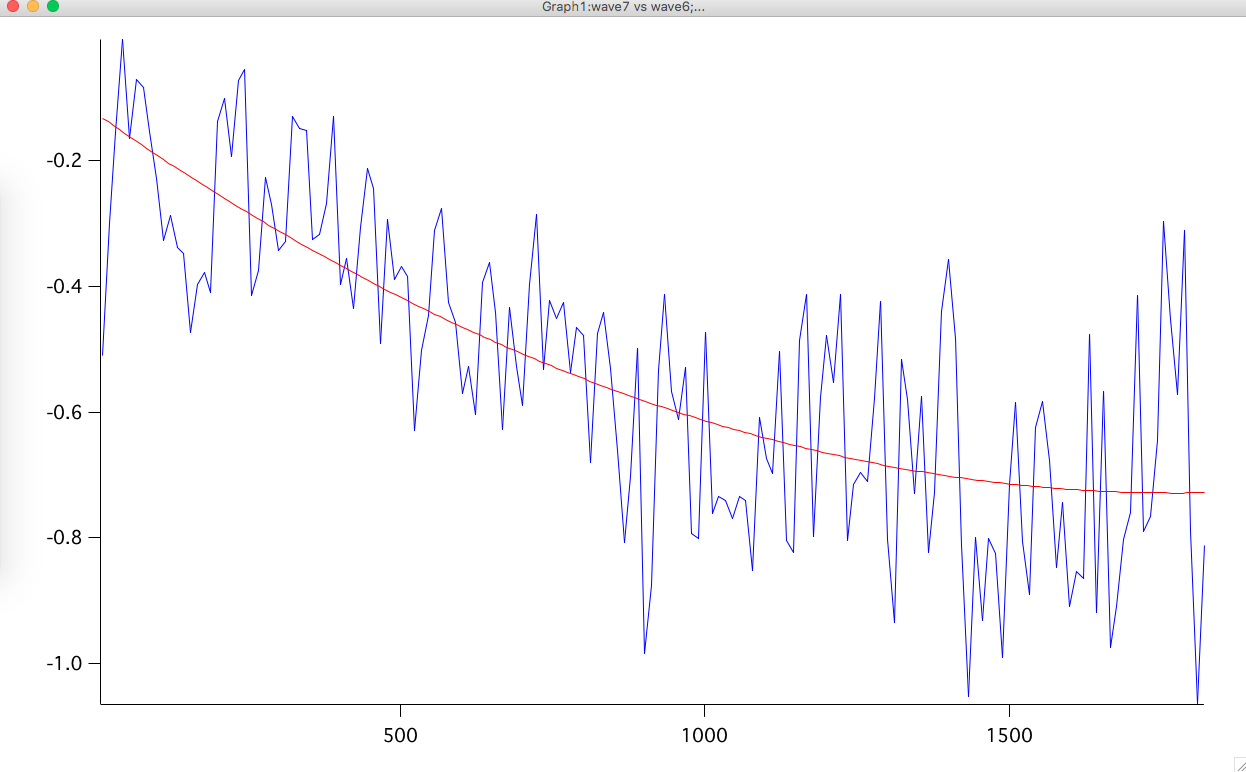
My tutor suggested I make a fit with a cubic polynomial.
So, I selected my curve (in blue) and then right click Analysis - Quick Fit - Poly - 3; so I got the red curve.
Now I should steal this polynomial curve to flatten my curve, as I do?
The data folder can be viewed using the data browser. Select the Data Menu and then the Data Browser item.
January 19, 2016 at 05:56 am - Permalink
If you click on that line, Igor will select the entire command. Now press Enter and Igor will copy it to the command line. Now click at the end and add a /R flag to the end, and press Enter again. The fit will be repeated, but this time will generate a new wave with "Res_" at the start of the name. That wave will contain the residuals, which is simply what you get when you subtract the fit from the original data.
John Weeks
WaveMetrics, Inc.
support@wavemetrics.com
January 19, 2016 at 10:36 am - Permalink
Perfect, thank you so much should be those who would like to get , tomorrow submit graphs to my tutor and let you know ! Thanks so much!!!
January 19, 2016 at 01:33 pm - Permalink
For a cubic fit you will need to use "Poly 4".
HJ
January 20, 2016 at 01:47 am - Permalink
Thanks you johnweeks, so it is perfect!!!
Also thanks for the suggestion to use "Poly 4" .
Now I also " isolate " the "fitting Graph".
I have to make other , then how can I combine them into one graph ?
January 20, 2016 at 06:04 am - Permalink
would display both fits in one window.
is an alternate version to add more traces.
Also, please have a look on the documentation of "display" and "appendtograph".
HJ
January 20, 2016 at 07:19 am - Permalink
Ok, i try it, but it is not what I want.
I try with:
display Res_data1 vs time1
appendtograph Res_data2 vs time1
It's probably works
January 20, 2016 at 07:26 am - Permalink