Image color corrections and resizing with discrete colors from seed wave


I have numerous contour images that have a small set of discrete fill colors, which are used by other software with a key-value-pair map to associate a color with a value; erroneous pixels skew these results. The contour lines and fills are computed by software I wrote that generates a TIFF or PNG, however, the output image tends to have artifacts between the discrete colors from interpolated resizing. My goal is to be able to leverage one of the existing image-processing methods by feeding it a wave of seed colors and allowing it to correct non-matching pixels with the greater count of seed-matching pixels in some HxV grid.
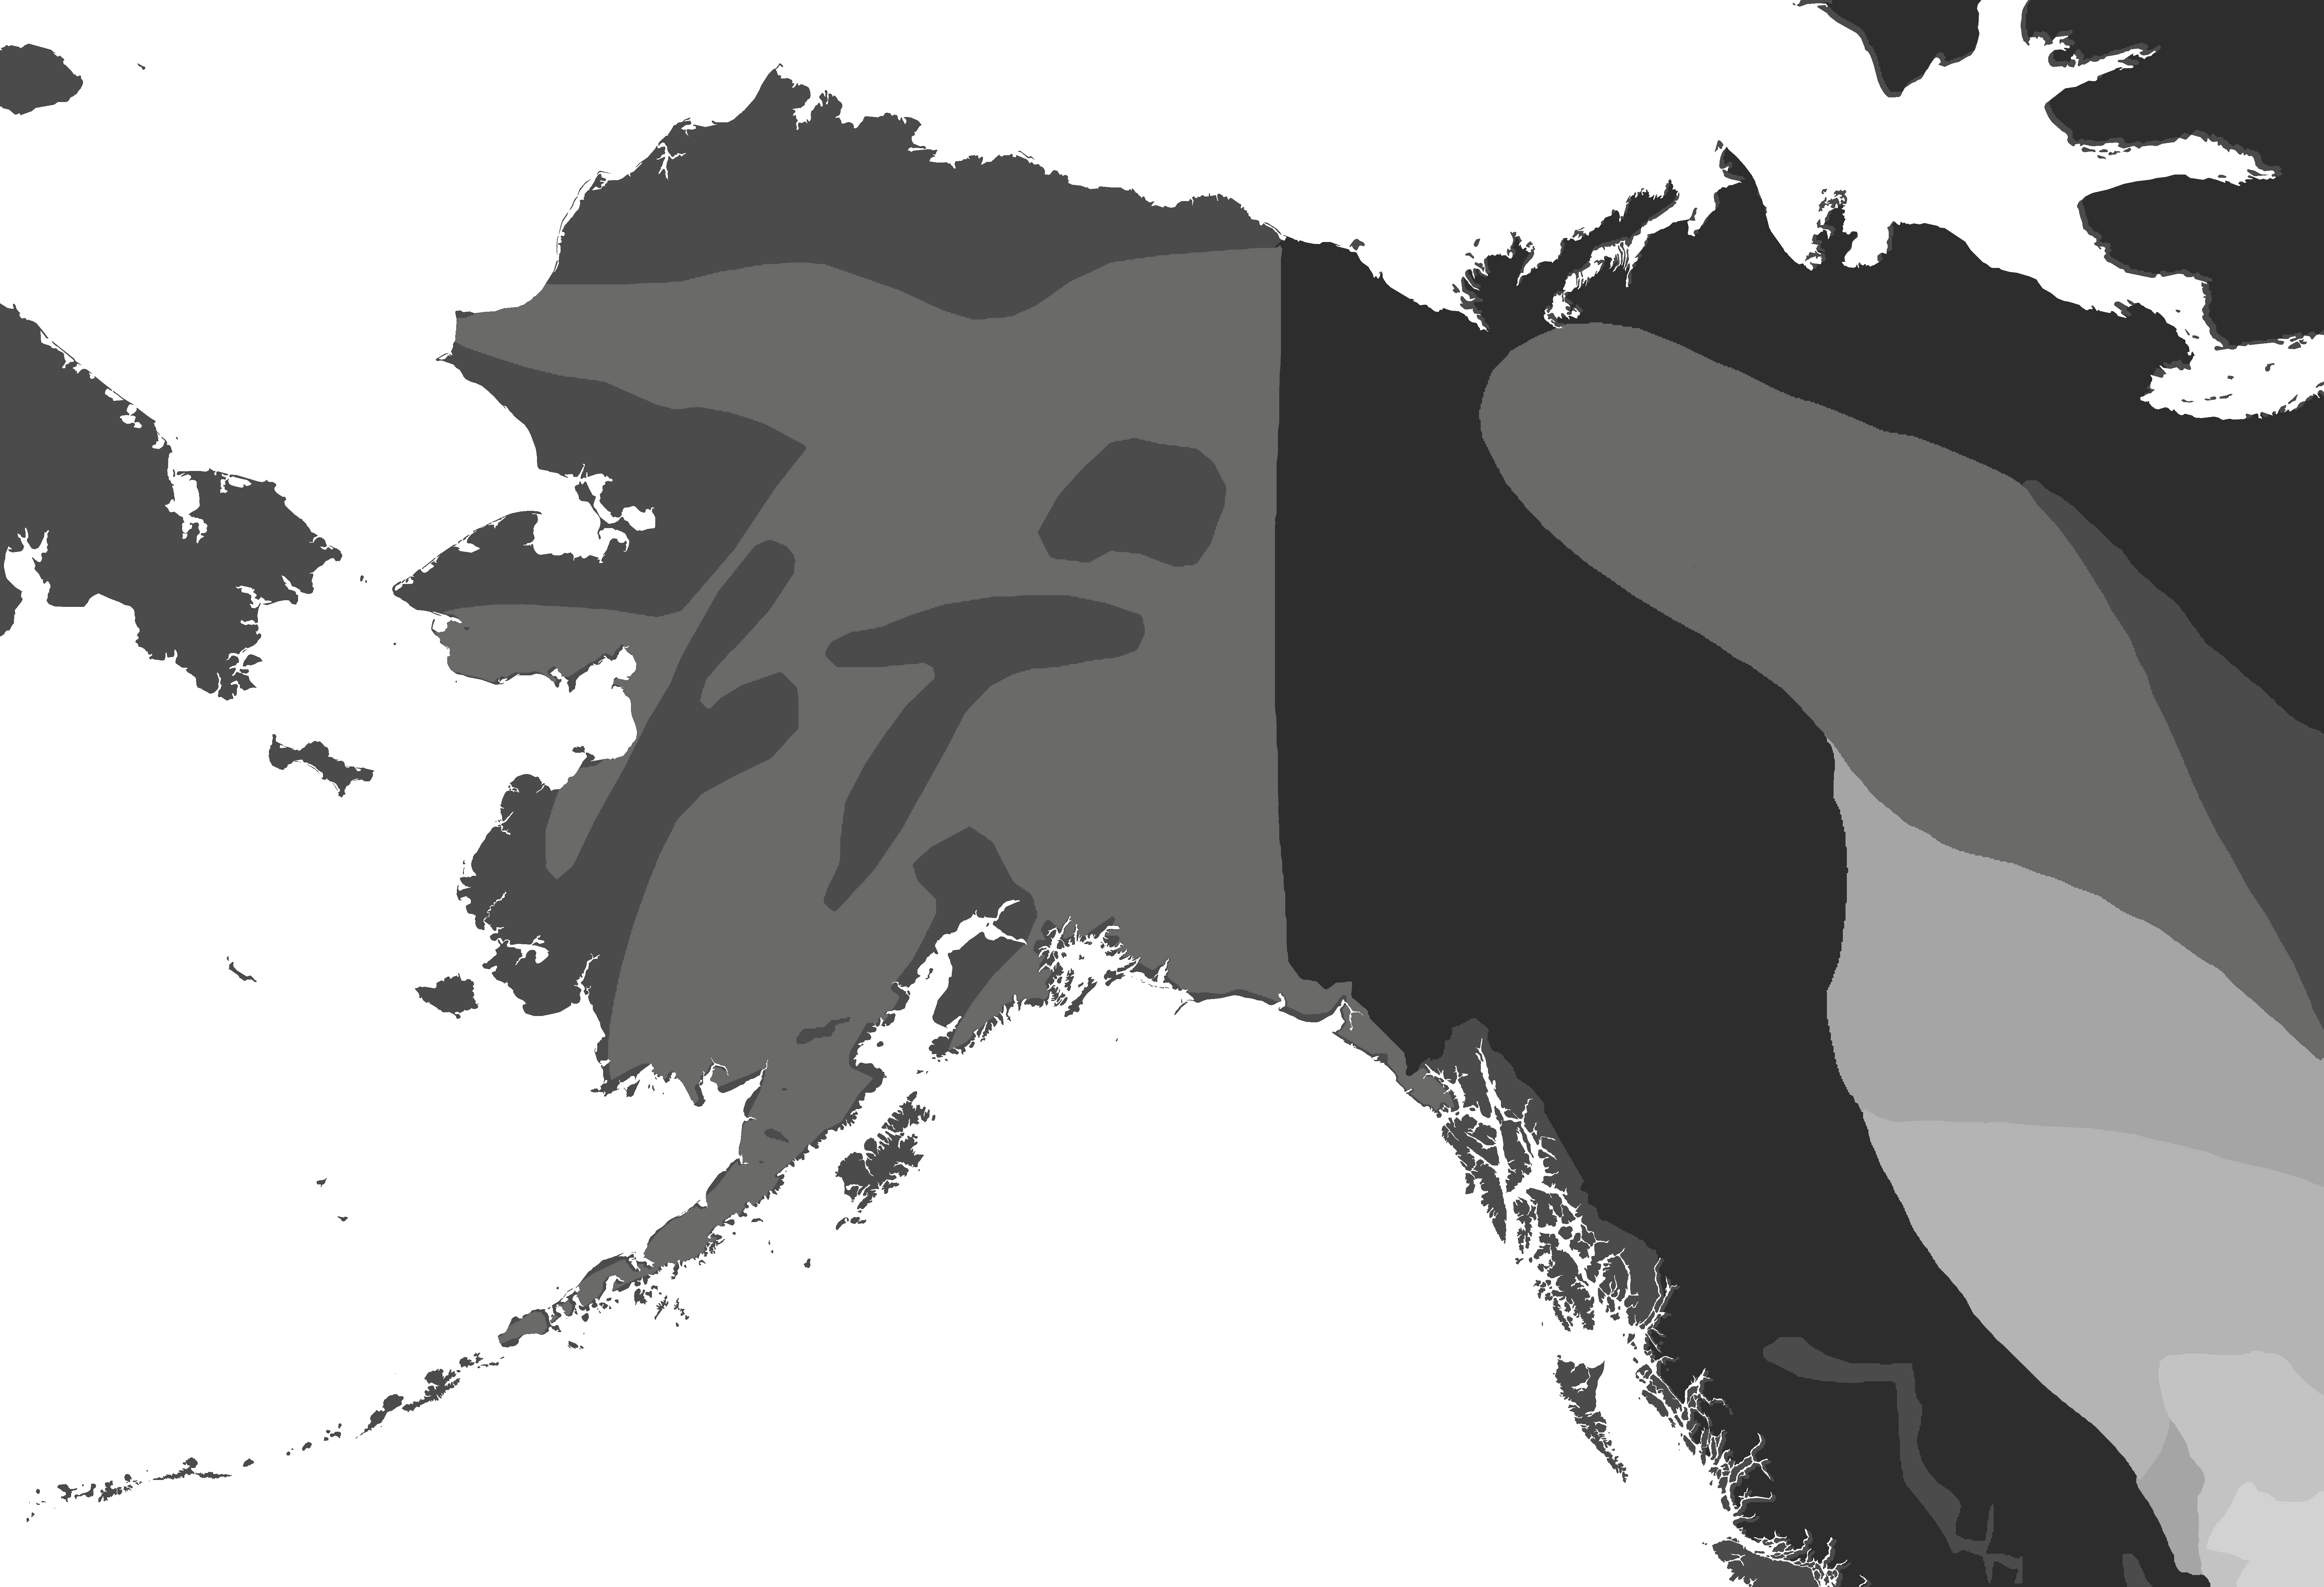
An example experiment and image are attached. I could not include a lot of my work in the experiment file due to size constraints. I have tried numerous methods using the built-in image-processing methods, however, each tends to produce undesired results.
- ImageSeedFill: required a lot of manual tweaking of parameters and methods--never was able to get a good result.
- ImageHistogramModification: this only had two options. Adaptive produced just as many non-desired colors as the original. Equalize removed non-desired colors, but also desired ones.
- ImageThreshold: there was no straight-forward way to use this for an entire image. Instead, I wound up going through the following steps for one single image:
- testx1 = test[p][q] == 255? 0 : 255 (basically setting the ocean to 0 and else to 255)
- testx1 = (test[p][q] <= 65 && test[p][q] >= 25) ? 45 : 255
- testx1 = test[p][q] == 75? 75: testx1
- ...
- testx1 = test[p][q] == 210 ? 210 : testx1
- Create a polygon ROI around one of the regions where white (z=255) values appear
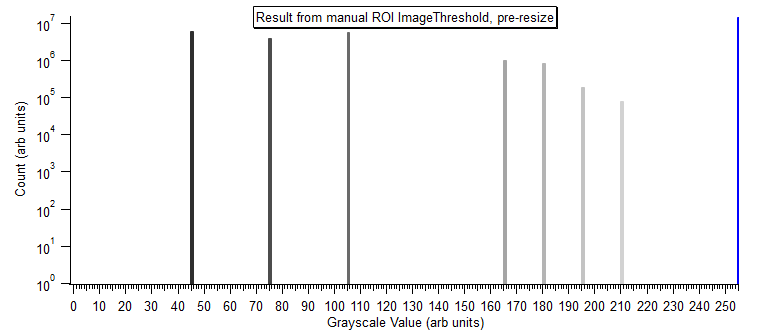
- Use ImageThreshold dialog with ROI, iterated, save overlay -- ImageThreshold /R=::'WMPrivate':IPdata:Graph24:ROI:M_ROIMask/Q/M=1/N/i testx1
- remove alpha layer, convert rgb2gray
- testx1 = M_RGB2Gray[p][q] == 255? 75: testx1 ~ the new value depended on the region
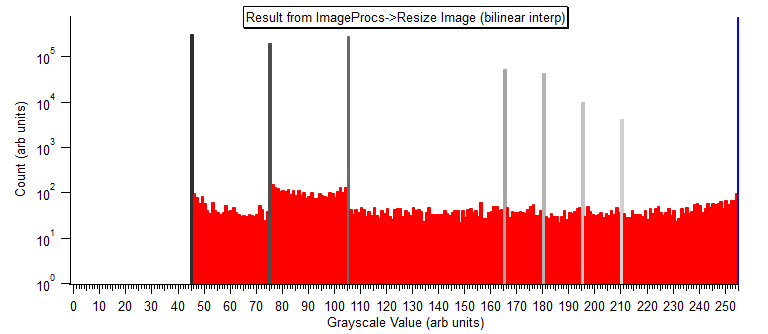
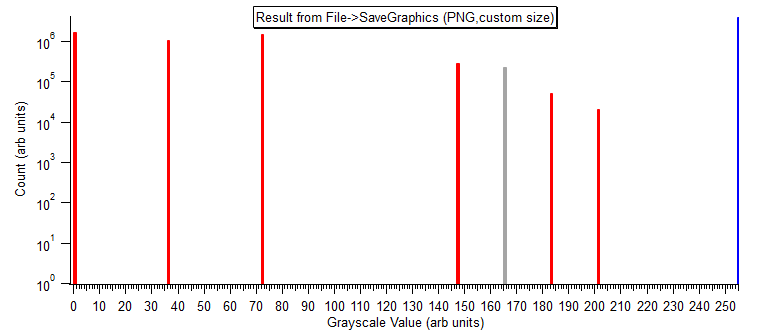
Ultimately, using the tedious ImageThreshold method I was able to get a good image. However, when I went to save the image or resize it, I wound up in the same situation as before with a bunch of interpolated pixels if I used a bilinear ImageInterpolation method to resize, or it completely altered the values of the colors if I tried using SaveGraphics.
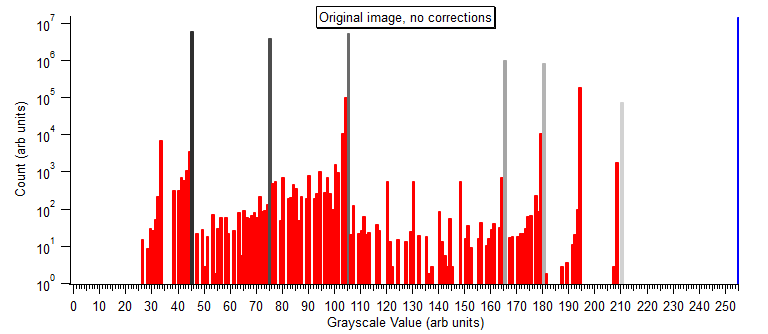
Below are some histograms showing results. Red bars are values that do not match the wave of discrete colors. There is a custom method in the main procedure window that I made for resizing the image with options and a preview -- set to Menu ImageProcs->Resize Image...
Any help/advice would be much appreciated. I was intending to go ahead and write a custom method to correct the colors with a seed wave of the discrete colors (as described at the top), but there are two things holding me back. First, these images are sometimes very large and iterating through groups of pixels can take 10+ minutes, whereas the built-in image-processing methods are very fast (I'm unsure how that's being achieved). Second, there may be some image-processing method or flag that I'm completely missing that can do exactly what I need it to do.
Thanks.
Rory Hamilton | Nuclear Effects & Survivability | Applied Research Associates

The approach I would take is to build a stack. Each layer in the stack would contain a slice for pixels at the desired color (grayscale) value or above. After I have the stack, I would do (clever) math to merge the slices.
Start with your seed color (grayscale) values in a wave. Iterate through that seed wave. For each value CVALUE in the seed wave
- Duplicate the original image to SIMAGE and RIMAGE (as free waves ... and use MatrixOP)
- Threshold SIMAGE to set all pixels at and above CVALUE to 1 and all values below CVALUE to zero or NAN
- Set RIMAGE = CVALUE * SIMAGE ==> this gives a slice at the desired CVALUE
- Put RIMAGE into a stack FIMAGESTACK
--> repeat at the next CVALUE
The "clever" math is likely handled at the outset. Recalculate the CVALUES array appropriately so that you get the final image that you want simply by adding the slices. For example, suppose your grayscale from 0 to 16 has these set points (0, 4, 8, 10, 13, 16). The threshold slices in the FIMAGESTACK would be binary (0, V) with V = (0, 4, 4, 2, 3, 3). As each plane is added together, you recover the set points adding the next slice in the stack.
I cannot comment on what to do while saving the final image other than to say AFAIK that TIFF is likely your best friend to avoid interpolation losses.
April 7, 2022 at 11:44 am - Permalink
Jeff,
Off topic, but I I live in Huntsville and saw in your profile that you're a professor at UAH. Are you still in Huntsville? You're also the first person who helped me out on here about 15 years ago with fixing a custom asymmetric-Gaussian fit function I wrote for alpha-particle spectroscopy, so thanks again!
To your suggestion, that's actually a really good idea, thanks. It's effectively what I was doing manually with ROI's, but more clever and can be automated. I was already thinking about importing the TIFF as a stack of layers (the software I wrote builds the ground-conductivity contours on layers for each value) and your suggestion makes that easy to tie in.
As for the final output, they're used in other software to calculate electric fields and I only use the final image output for distributing to groups who (for various reasons) have yet to, or cannot, update to the newer software version I wrote. For final output, I save the image grayscale data to file as a table (i.e., the saveImageTable(...) method in that experiment file) and run a script to convert it into a single "multi-document" JSON file with the values formatted into strings (for faster parsing at load) and arrays that provide the Lat/Lon parameters to convert from geodetic to XY-point. The updated software has a 2-D table-lookup class that uses SIMDJSON to parse and load the "JSON image" and builds a table. This was intended to eliminate the various discrepancies that sometimes occur with different RGB-image libraries and platforms. It's also about 100x faster than loading an image, converting geodetic to XY-pixel, extracting the RGB values, nested iterations to lookup the color name, cross-referencing color name to conductivity value...
The only challenge still is a method to resize the image without introducing interpolated values outside the values in the image or seed wave. Though the input images are written to JSON, it's usually unnecessary to have 70k (H) x 50k (V) data for a small area, e.g., Maui. I think I'll try writing a method scale the image and selecting the pixel value by highest count of values in the grid each pixel is derived from. Otherwise, I should be able to use the reverse of the process you suggested.
Thanks again.
Rory Hamilton | Nuclear Effects & Survivability | Applied Research Associates
April 7, 2022 at 12:23 pm - Permalink
If you would like more specific help please contact support@wavemetrics.com. It would help if you could send an experiment containing sample data.
A.G.
April 7, 2022 at 12:40 pm - Permalink
A.G.,
The experiment with sample data (as well as the original sample image) is attached to my original post above, but I'll send it to the support address. Thanks.
April 7, 2022 at 12:43 pm - Permalink
The trade off is the processing work to re-threshold after downsizing interpolation losses versus simply cutting new interpolation losses directly after downsizing. In the latter case, you might improve the end result by transferring the bit image into a real-valued matrix, downsizing (image interpolating) on the real-valued matrix to a smaller size, resetting the smaller-sized real-valued matrix back to the desired integer bit size, and then doing threshold. I'd be curious to see this approach side-by-side to the results from manually post-processing RoIs on images after downsizing.
Otherwise, yes I'm still at UAH. Email me directly at my address there. Given the mutual interest in Igor Pro, perhaps we should arrange to meet. Since my days with Igor Pro spectroscopy, I've also crossed over to doing image processing (see the Image Tools and Radial Profiler packages). There's even more fun in image processing than trying to figure out asymmetric peak shapes for spectroscopy. :-)
April 7, 2022 at 12:49 pm - Permalink
Silly question, but why did you do interpolated resizing on the images in the first place?
With that said I would just use a simple color correction wave. Let's say your interpolated image has 256 unique colors, but you only actually only used 16 in the original image. The color correction wave would have now 256 points, one for each color in the interpolated image, and each point would have the value you want it to correspond to (0-15). Now you simply do:
April 7, 2022 at 12:58 pm - Permalink
In reply to Silly question, but why did… by olelytken
Rory HamiltonI've done some searching and testing but have not come across an image-resizing operation that retains only true colors from the original image. Most perform some sort of interpolation to determine the RGB/Gray for a resized pixel, and every method I've tried winds up leaving some number of values that did not exist in the original image. For the resizing operation, I used an example someone shared on the forum that used the bilinear ImageInterpolate method because it produced the fewest errors.
However, if I prep the figure before using File->Save Graphics (set margins to 1--it won't accept 0--and disable the axes/ticks/labels), it usually does not produce a variety of artifacts, but it shifts the grayscale values by some order I don't understand. E.g., 105 became 0, 180 became 165, etc. See below.
Using SaveGraphics, I have to remove the last column/row to trim that margin from saving the figure, and then correct the colors to what they should be, which is easy when there are only a few colors and they remain discrete. This is an ok method for small images with only a few discrete colors, but some images have upwards 30 discrete grayscale values and they wind up getting lumped into the same 256-bin and I cannot correct it at that point.
I plan to work on a method that restricts the selection of colors for the resized-pixel choice by colors that only existed in the sample grid. Unless someone has a better suggestion.
Thanks for the suggestion with this. I will give it a try and let you know how it worked.
April 7, 2022 at 02:41 pm - Permalink
In reply to Silly question, but why did… by olelytken
jjweimer> @olelytken said MultiThread ...
So suppose we have an NxM image with C color levels that we want to split into Q color slices. Suppose we could optimize (multi-thread/matrixop) these two approaches
* threshold the NxMxC image Q times agains an array of length Q, store each slice into image stack, and recombine the slices
* correct the NxMxC image into an NxMxQ image using an array of length C
I wonder where would be the cut in speed? Would both approaches give exactly the same result (I suspect they should)?
April 7, 2022 at 08:58 pm - Permalink
In reply to olelytken wrote: Silly… by Rory Hamilton
tonywave assignments for image waves don't perform interpolation.
create a wave of the desired image size
set scale to match original wave
make wave assignment
April 8, 2022 at 01:36 am - Permalink
A lot of very simple image viewers like IrfanView or XnView will let you adjust the color depth of your image. Have you tried adjusting the color depth of your image to the number of unique colors before you resize the image?
April 8, 2022 at 08:11 am - Permalink
I actually tried out Tony's suggestion and was quite surprised. It came out perfect. I did not know you could do something like that with wave assignments for an image. It's still a bit of a mystery to me, so I'll have to look a little closer at that IndexToScale function.
Side question: what is the different between using parenthesis around (x) and (y) here and brackets around [r]?
April 8, 2022 at 11:01 am - Permalink
In reply to The trade off is the… by jjweimer
Rory HamiltonJeffrey, wanted to let you know the link in your profile to your faculty page is broken, but I was able to find the page and sent you an email. UAH seems to have added your middle initial to it: https://www.uah.edu/eng/departments/cme/faculty-staff/jeffrey-j-weimer
April 8, 2022 at 11:06 am - Permalink
Round parentheses take scaled dimension values, square brackets take dimension numbers. So use round parens when you have x, y, x, t and use square brackets when you have p, q, r, s.
DisplayHelpTopic "Waves"
But especially for this question:
DisplayHelpTopic "Waveform Arithmetic and Assignment"
April 8, 2022 at 11:19 am - Permalink
see also
DisplayHelpTopic "Multidimensional Wave Indexing"
and the following section, Multidimensional Wave Assignment
in your case r = z and (x)(y)(z) will work too.
April 8, 2022 at 11:28 am - Permalink
General comments for anyone trying the histograms mentioned above:
1. A quick shortcut is through the obscure ImageTransform rgb2cmap. For example:
Here 10 was a non-essential upper estimate for the number of requested colors. The results of this avoid some of the pitfalls of applying the histogram operation (see another solution below).
2. Some comments above indicate a misunderstanding of the ImageInterpolate operation. The operation allows specific control of the non-interpolation result as shown in the following example:
This is a trivial example of 2x magnification without generating new colors.
If you want to verify that you are getting the correct color values you may find this useful:
I should note that the nearest neighbor approach is not as computationally efficient as some of the multi-threaded wave assignments but it is less likely to produce any strange results on value boundaries.
A.G.
April 8, 2022 at 12:22 pm - Permalink
In reply to General comments for anyone… by Igor
Rory HamiltonAG, this is a clever and simple way to generate the index instead of doing a histogram. Thank you. I always like learning new ways to do something, especially more confident ways.
This was also very helpful. I did read through the documentation for ImageInterpolate, but somehow overlooked this.
April 11, 2022 at 07:05 am - Permalink