I have an excel file having time series of air pollution data (column 1 date and time, column 2 CO2 value, column 3 SO2 value etc). Now I need to write a script that loads this excel sheet data to create waves and I can use it further to plot time series.
Have you successfully loaded an Excel file using the Load Excel File function under the Data>Load Wave> Load Excel File
You should have been presented with a Dialgog window that looks like this:
This is a starting point. This will help you identify the code you will use to automate this if you have multiple files.
Somethings that are import are in your files is the worksheet name always the same or do you need to read it?
Is the data always in the same spot - rows/columns?
Some other considerations include if you have multiple files do you need to load them all in or are you going to process then one at a time. If you process one at a time you can get away with overwriting the waves and simplifies the task. If you need to load multiple then you will need to decide on a naming strategy. Since your first column is a date/time you will probably want several waves in order to preserve the formatting types.
When you load the file this way look at the history window for the command used to load it. You can repurpose it for an automated script.
One workflow I do often is to load one file and create the graph I like. Then I add a control bar to that graph along with a button that sets the folder path to directory with all the files I am interested in using the NewPath command. I then create a popup menu for the file names using indexedfile() function to supply the match file names. Lastly I create a function that takes the selection from the popup menu and the previously set path and loads that file overwriting the waves. This will cause the graph to regenerate with the new data and run any analysis if I have included it in the function.
Thanks for the reply. Can you please tell me the script to load the same excel file ( stored in D drive) using procedure instead of the Dialgog window that shared above.
Now one more issue. I successfully loaded the excel file containing date and time column and corresponding pollutant valve. But the date and time column changes to numeric values. I know that Igor has different way of reading reading date and time. But for plotting the time series of the pollutant I need the date and time column wave in correct format. I tried to change the format of date and time column but it didn't work. I am attaching the excel sheet and the pic of incorrect format of date and time wave.
Please help me out with this issue. Thanks in advance.
I managed to convert the date and time into seconds but while plotting it remains in seconds even though I check date and time entry format (pic attached)


Hi,
Can you provide a bit more detail as to what you need the script to do.
Also have you manually loaded one of your Excel files to your satisfaction?
Andy
February 9, 2023 at 01:17 pm - Permalink
In reply to Hi, Can you provide a… by hegedus
dwivedi652I have an excel file having time series of air pollution data (column 1 date and time, column 2 CO2 value, column 3 SO2 value etc). Now I need to write a script that loads this excel sheet data to create waves and I can use it further to plot time series.
February 9, 2023 at 02:28 pm - Permalink
Hi,
Have you successfully loaded an Excel file using the Load Excel File function under the Data>Load Wave> Load Excel File
You should have been presented with a Dialgog window that looks like this: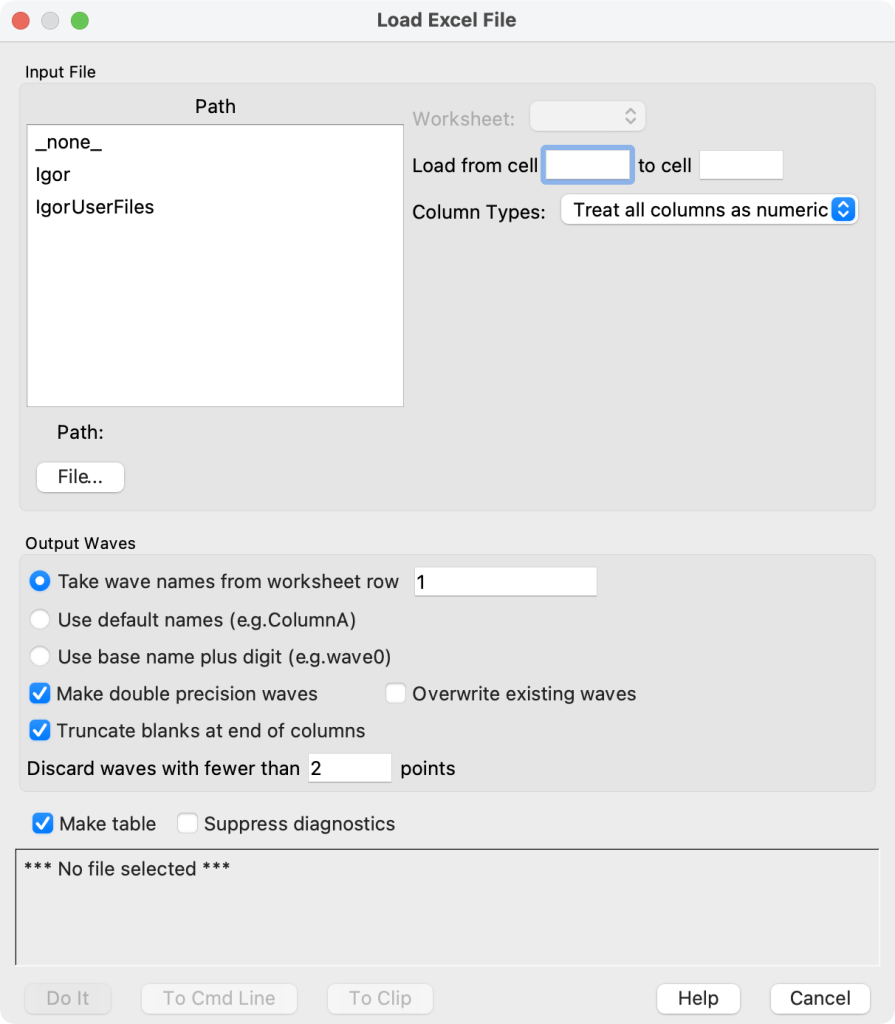
This is a starting point. This will help you identify the code you will use to automate this if you have multiple files.
Somethings that are import are in your files is the worksheet name always the same or do you need to read it?
Is the data always in the same spot - rows/columns?
Some other considerations include if you have multiple files do you need to load them all in or are you going to process then one at a time. If you process one at a time you can get away with overwriting the waves and simplifies the task. If you need to load multiple then you will need to decide on a naming strategy. Since your first column is a date/time you will probably want several waves in order to preserve the formatting types.
When you load the file this way look at the history window for the command used to load it. You can repurpose it for an automated script.
One workflow I do often is to load one file and create the graph I like. Then I add a control bar to that graph along with a button that sets the folder path to directory with all the files I am interested in using the NewPath command. I then create a popup menu for the file names using indexedfile() function to supply the match file names. Lastly I create a function that takes the selection from the popup menu and the previously set path and loads that file overwriting the waves. This will cause the graph to regenerate with the new data and run any analysis if I have included it in the function.
Andy
February 9, 2023 at 02:50 pm - Permalink
In reply to Hi, Have you successfully… by hegedus
dwivedi652Hi! Andy,
Thanks for the reply. Can you please tell me the script to load the same excel file ( stored in D drive) using procedure instead of the Dialgog window that shared above.
Anubhav
February 10, 2023 at 01:09 am - Permalink
In reply to Hi, Have you successfully… by hegedus
tonyFebruary 10, 2023 at 01:21 am - Permalink
In reply to hegedus wrote: When… by tony
dwivedi652Thanks Tony!
Now one more issue. I successfully loaded the excel file containing date and time column and corresponding pollutant valve. But the date and time column changes to numeric values. I know that Igor has different way of reading reading date and time. But for plotting the time series of the pollutant I need the date and time column wave in correct format. I tried to change the format of date and time column but it didn't work. I am attaching the excel sheet and the pic of incorrect format of date and time wave.
Please help me out with this issue. Thanks in advance.
February 10, 2023 at 02:24 am - Permalink
execute:
DisplayHelpTopic "Excel Date/Time Versus Igor Date/Time"
February 10, 2023 at 03:19 am - Permalink
In reply to execute: DisplayHelpTopic … by tony
dwivedi652I managed to convert the date and time into seconds but while plotting it remains in seconds even though I check date and time entry format (pic attached)
February 10, 2023 at 03:35 am - Permalink
To display as date, your X wave (datetime_pc_kst) must have "dat" data units:
Execute this for an explanation:
February 13, 2023 at 06:23 pm - Permalink