Need help plotting a 2D matrix


Hi All,
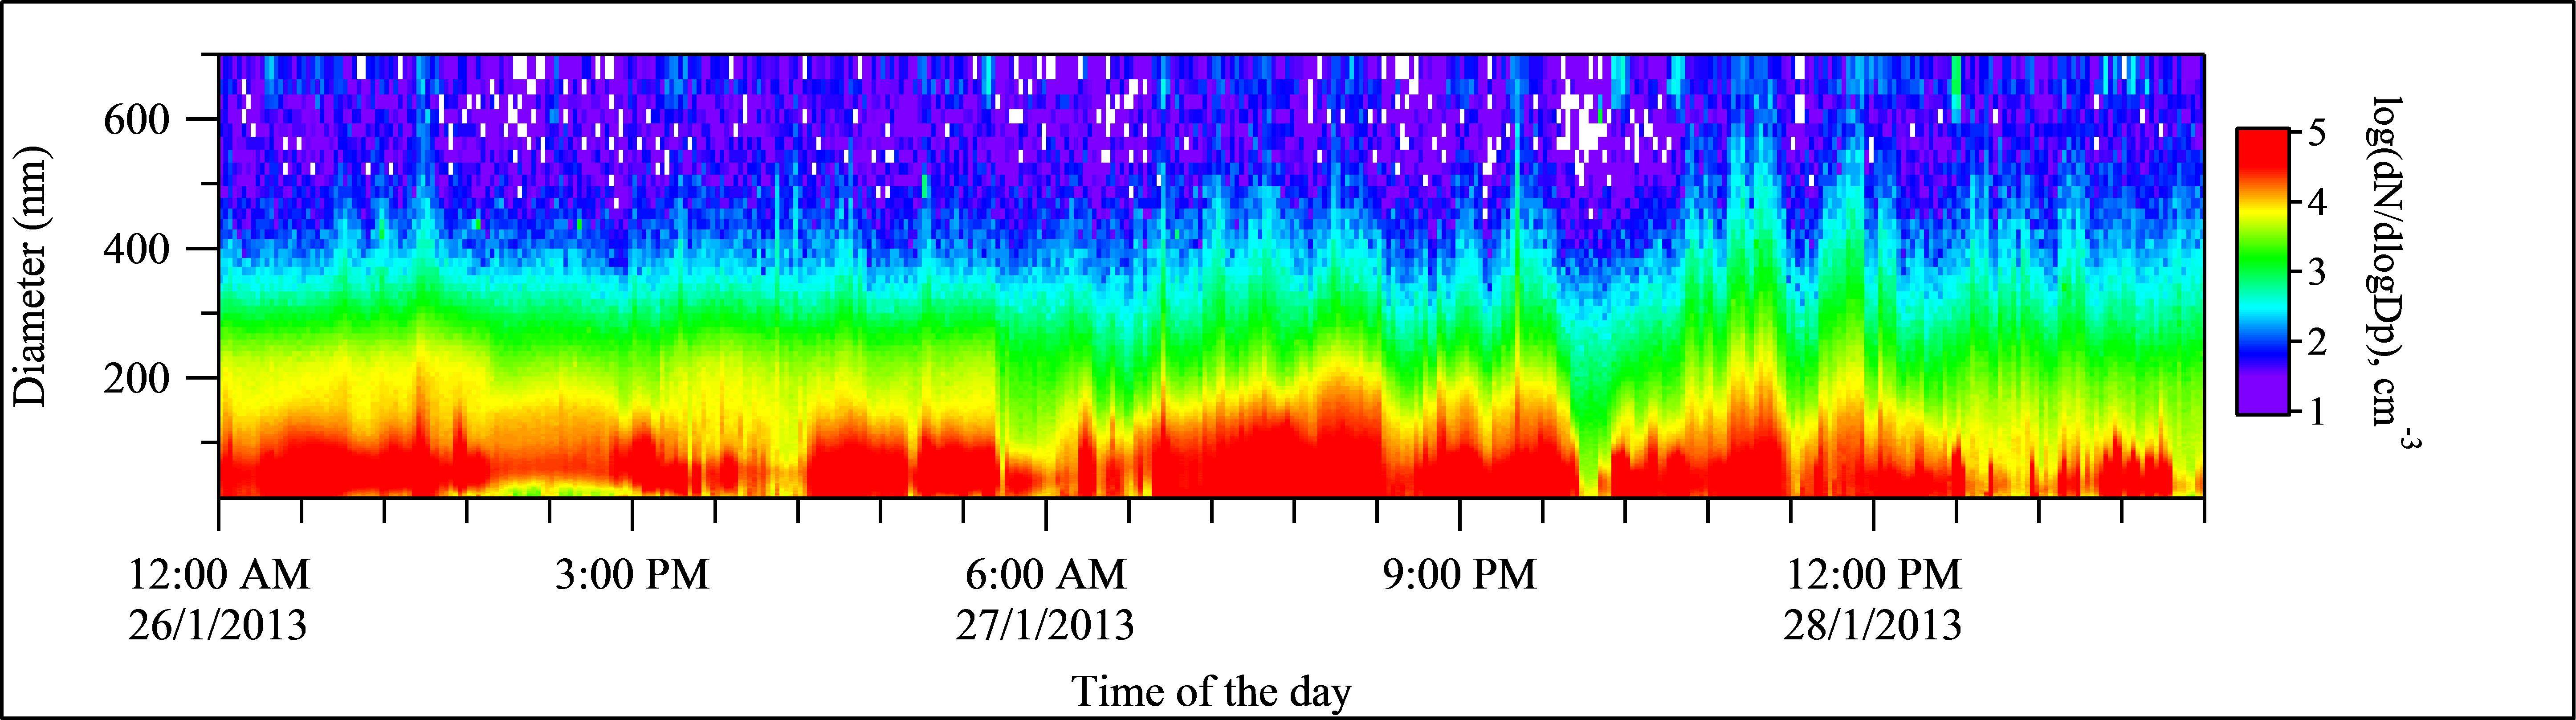
I am having difficulties plotting a 2D matrix showing how a particle number distribution changes with time. For this image, the x axis is the date/time, y axis is the particle diameter, and the number concentration for each particle size bin is represented as a color based on a color bar. An example of the type of figure I want to make is shown in the attached jpeg file (2D matrix I want to make).
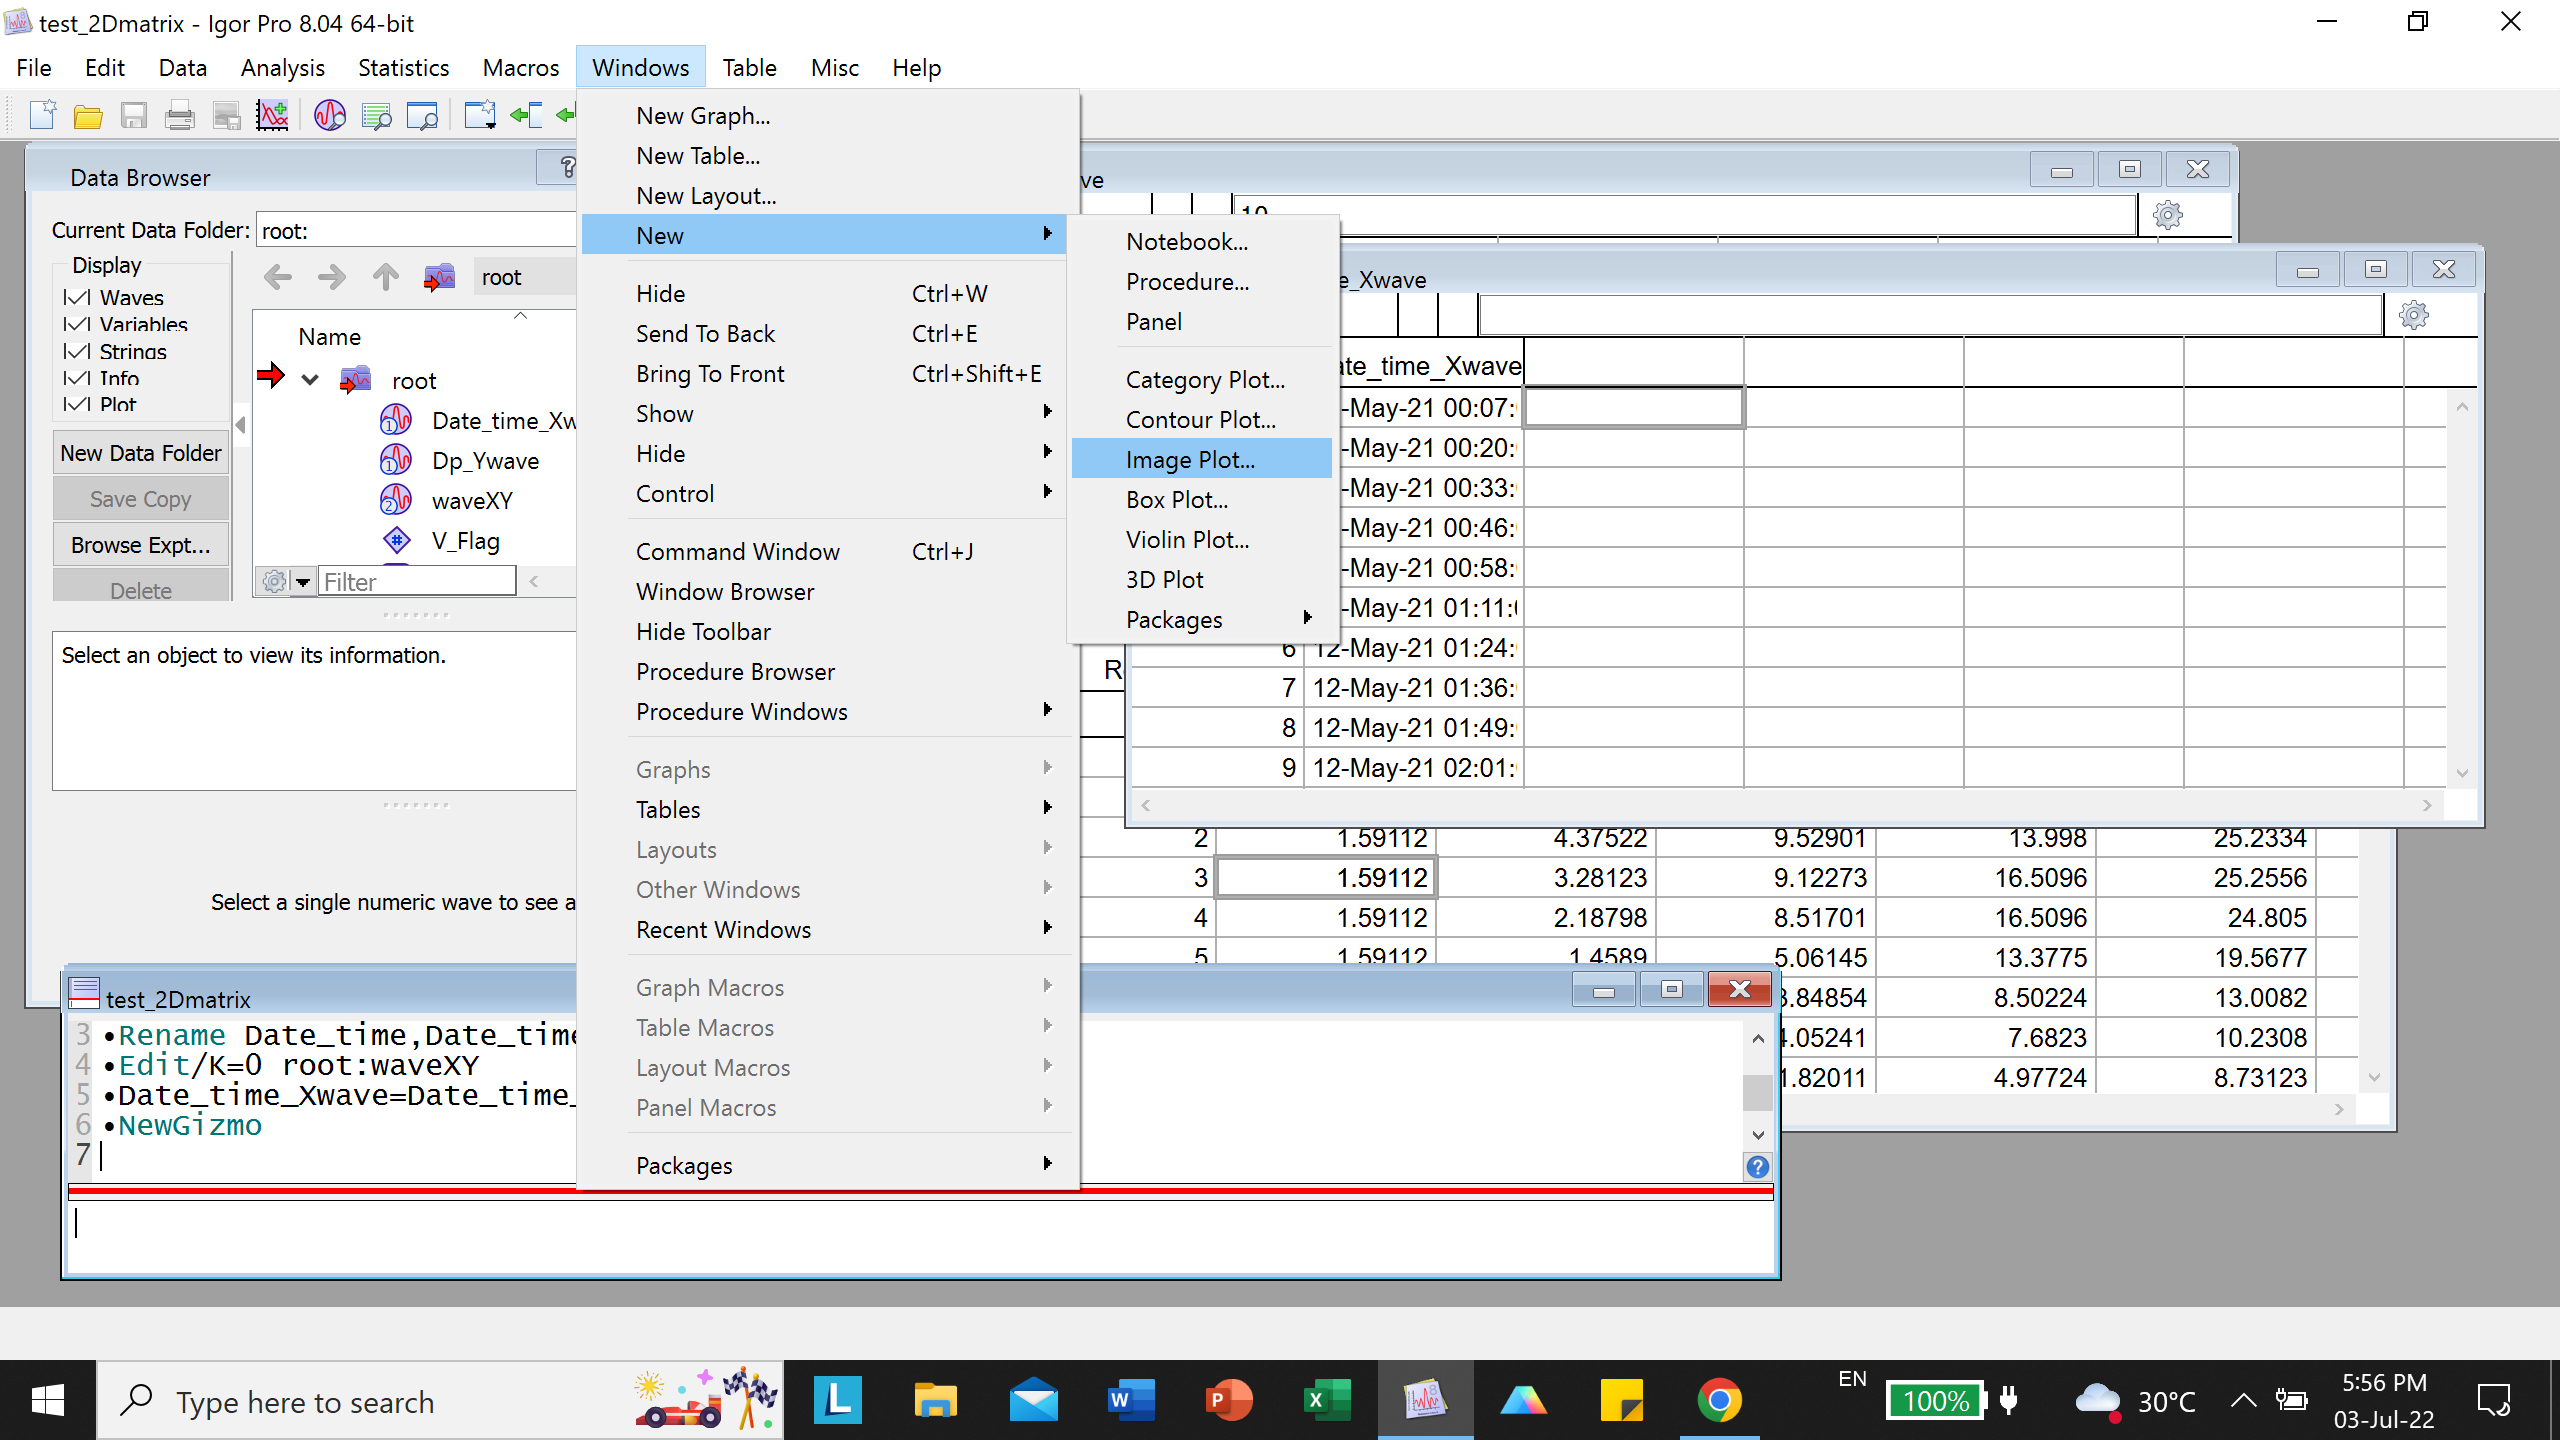
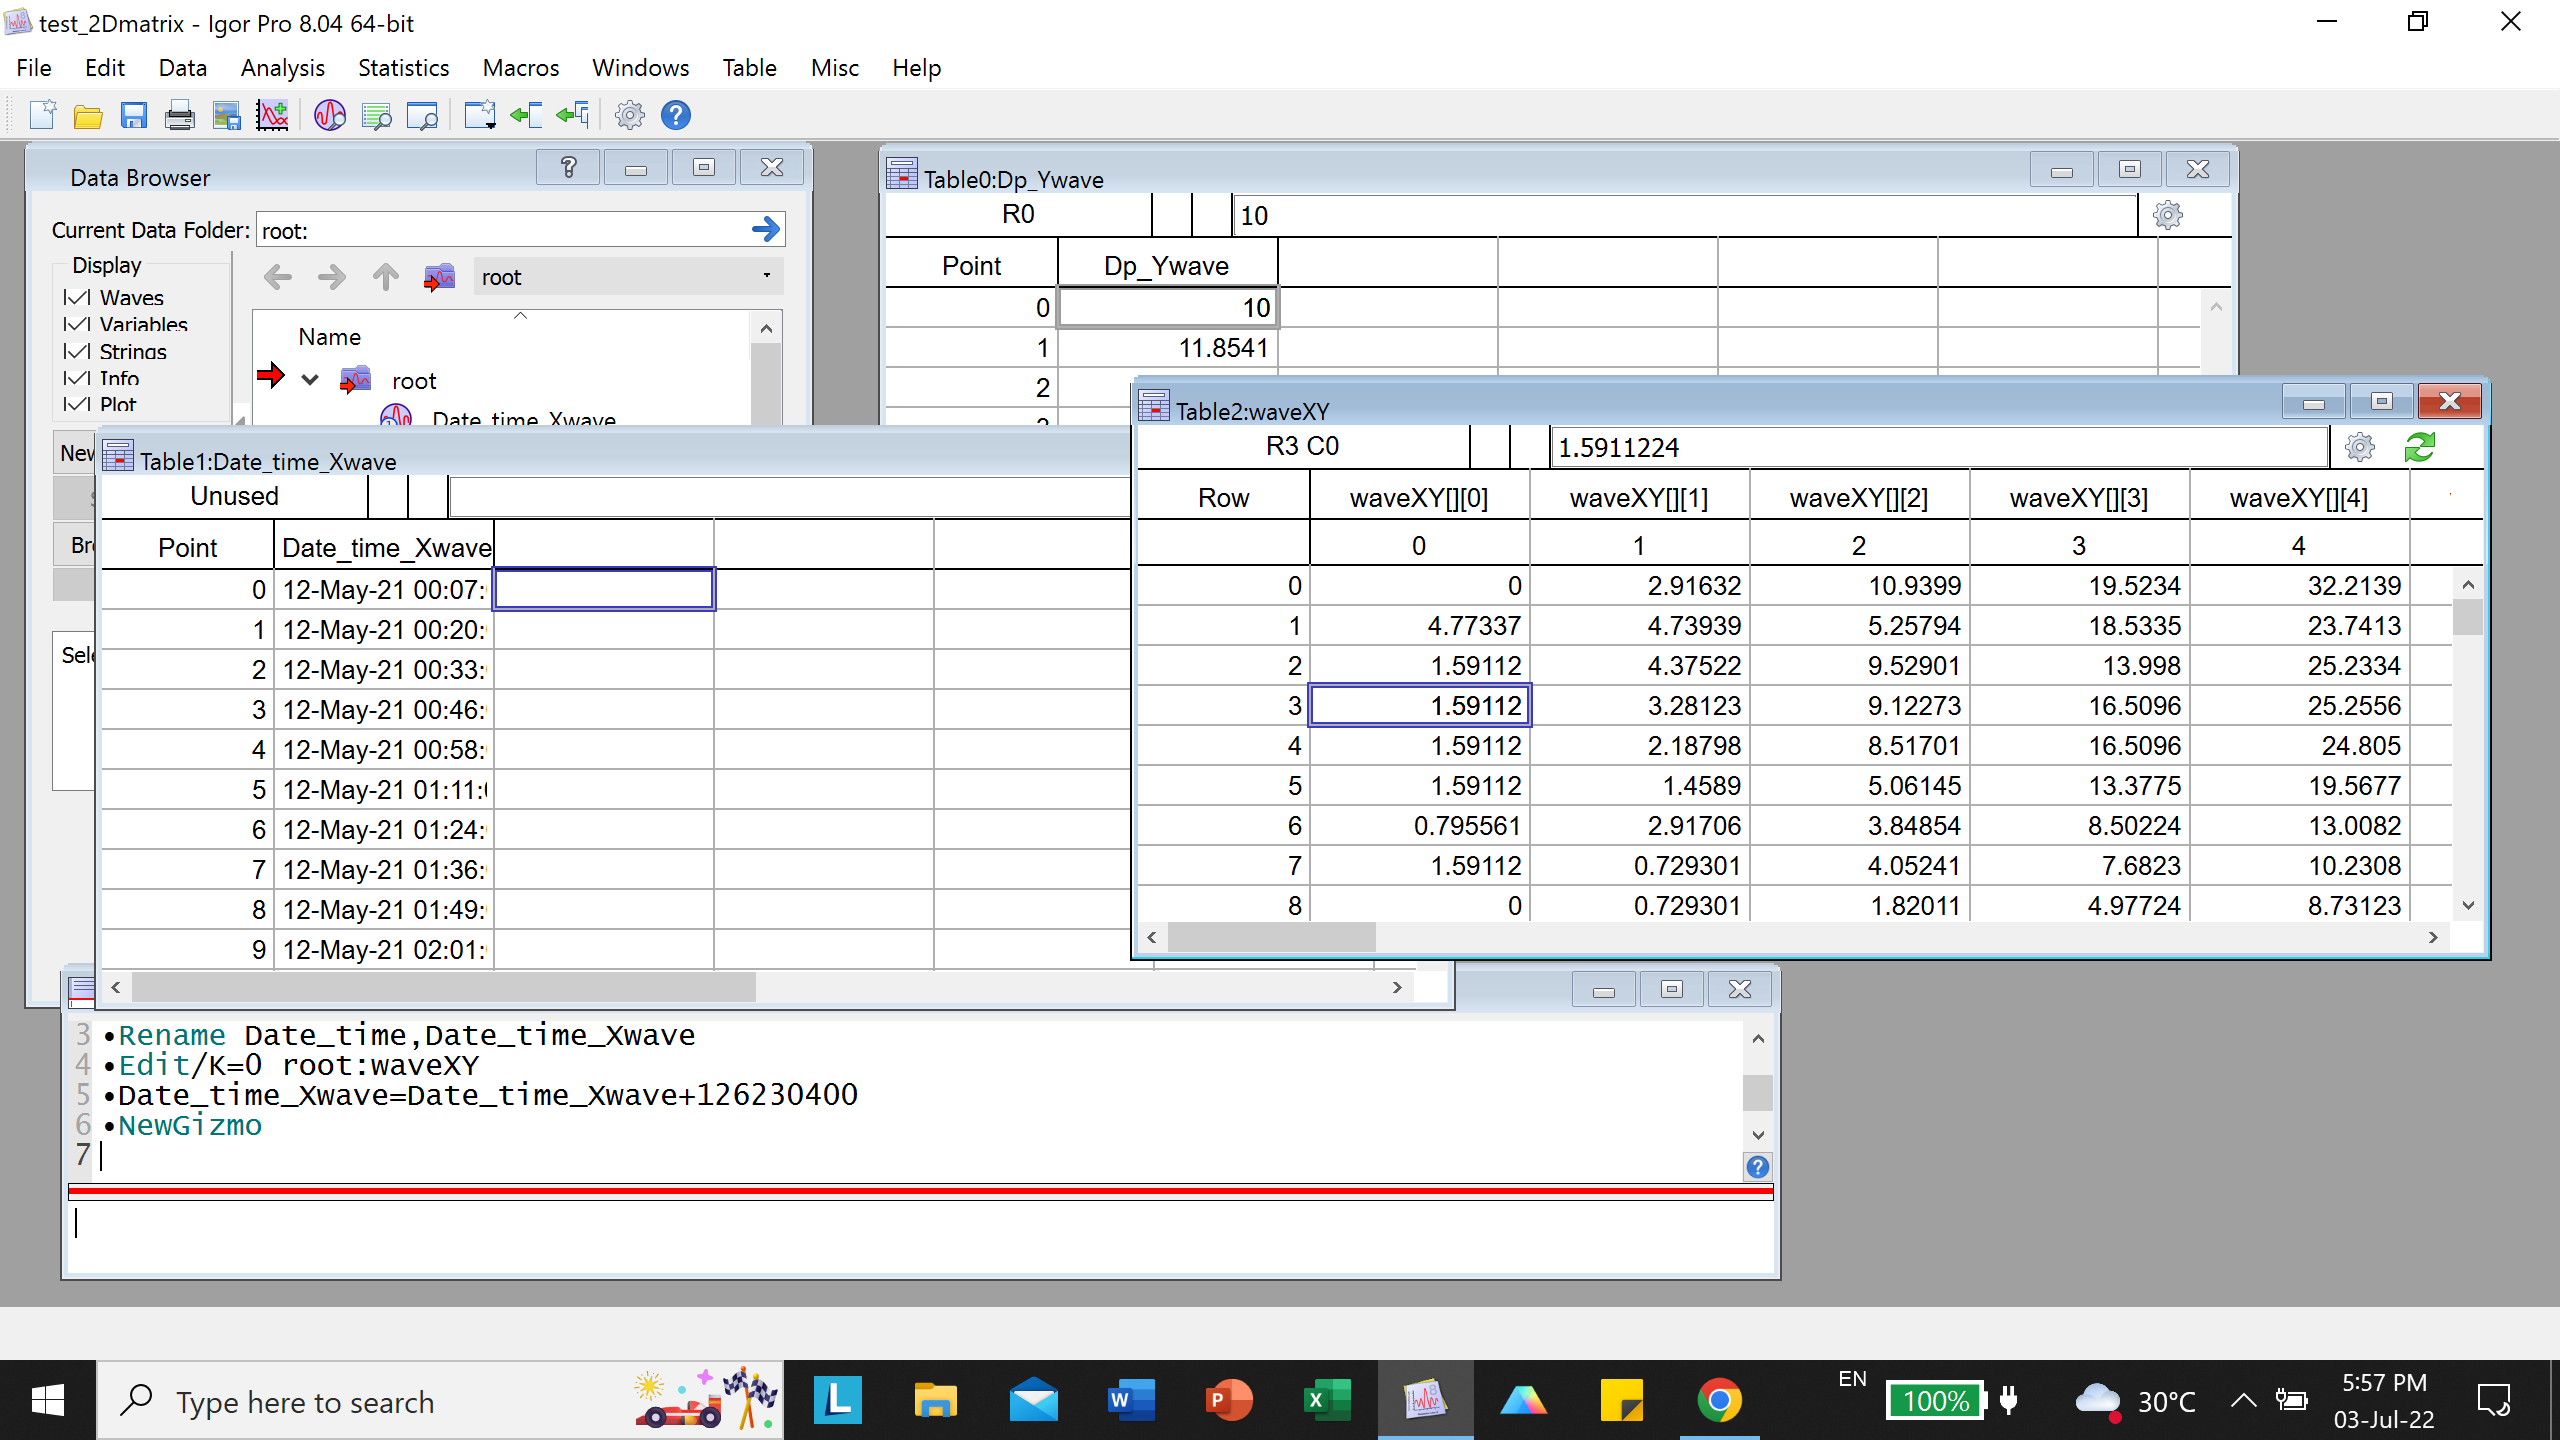
Based on what I have read in the forum, I have created a XY matrix that shows the number concentration for each particle diameter as a function of time, a time wave (named Date_time_waveX), and a particle diameter wave (named Dp_Ywave). However, when I clicked Windows>New>Image plot (see screenshot (1), I am not able to choose my x wave and y wave (see screenshot (2) and (3)). Basically, I am forced to choose the root folder for my x and y waves but my time waves and particle diameter waves are not showing up under the root folder.
I am not sure what I did wrong and how to proceed. I know it is likely I missed something while going through the forum and the manual but I can't figure out what it is. I would appreciate it if someone can provide some insights as to what I did wrong. I have attached my file. Thanks in advance.
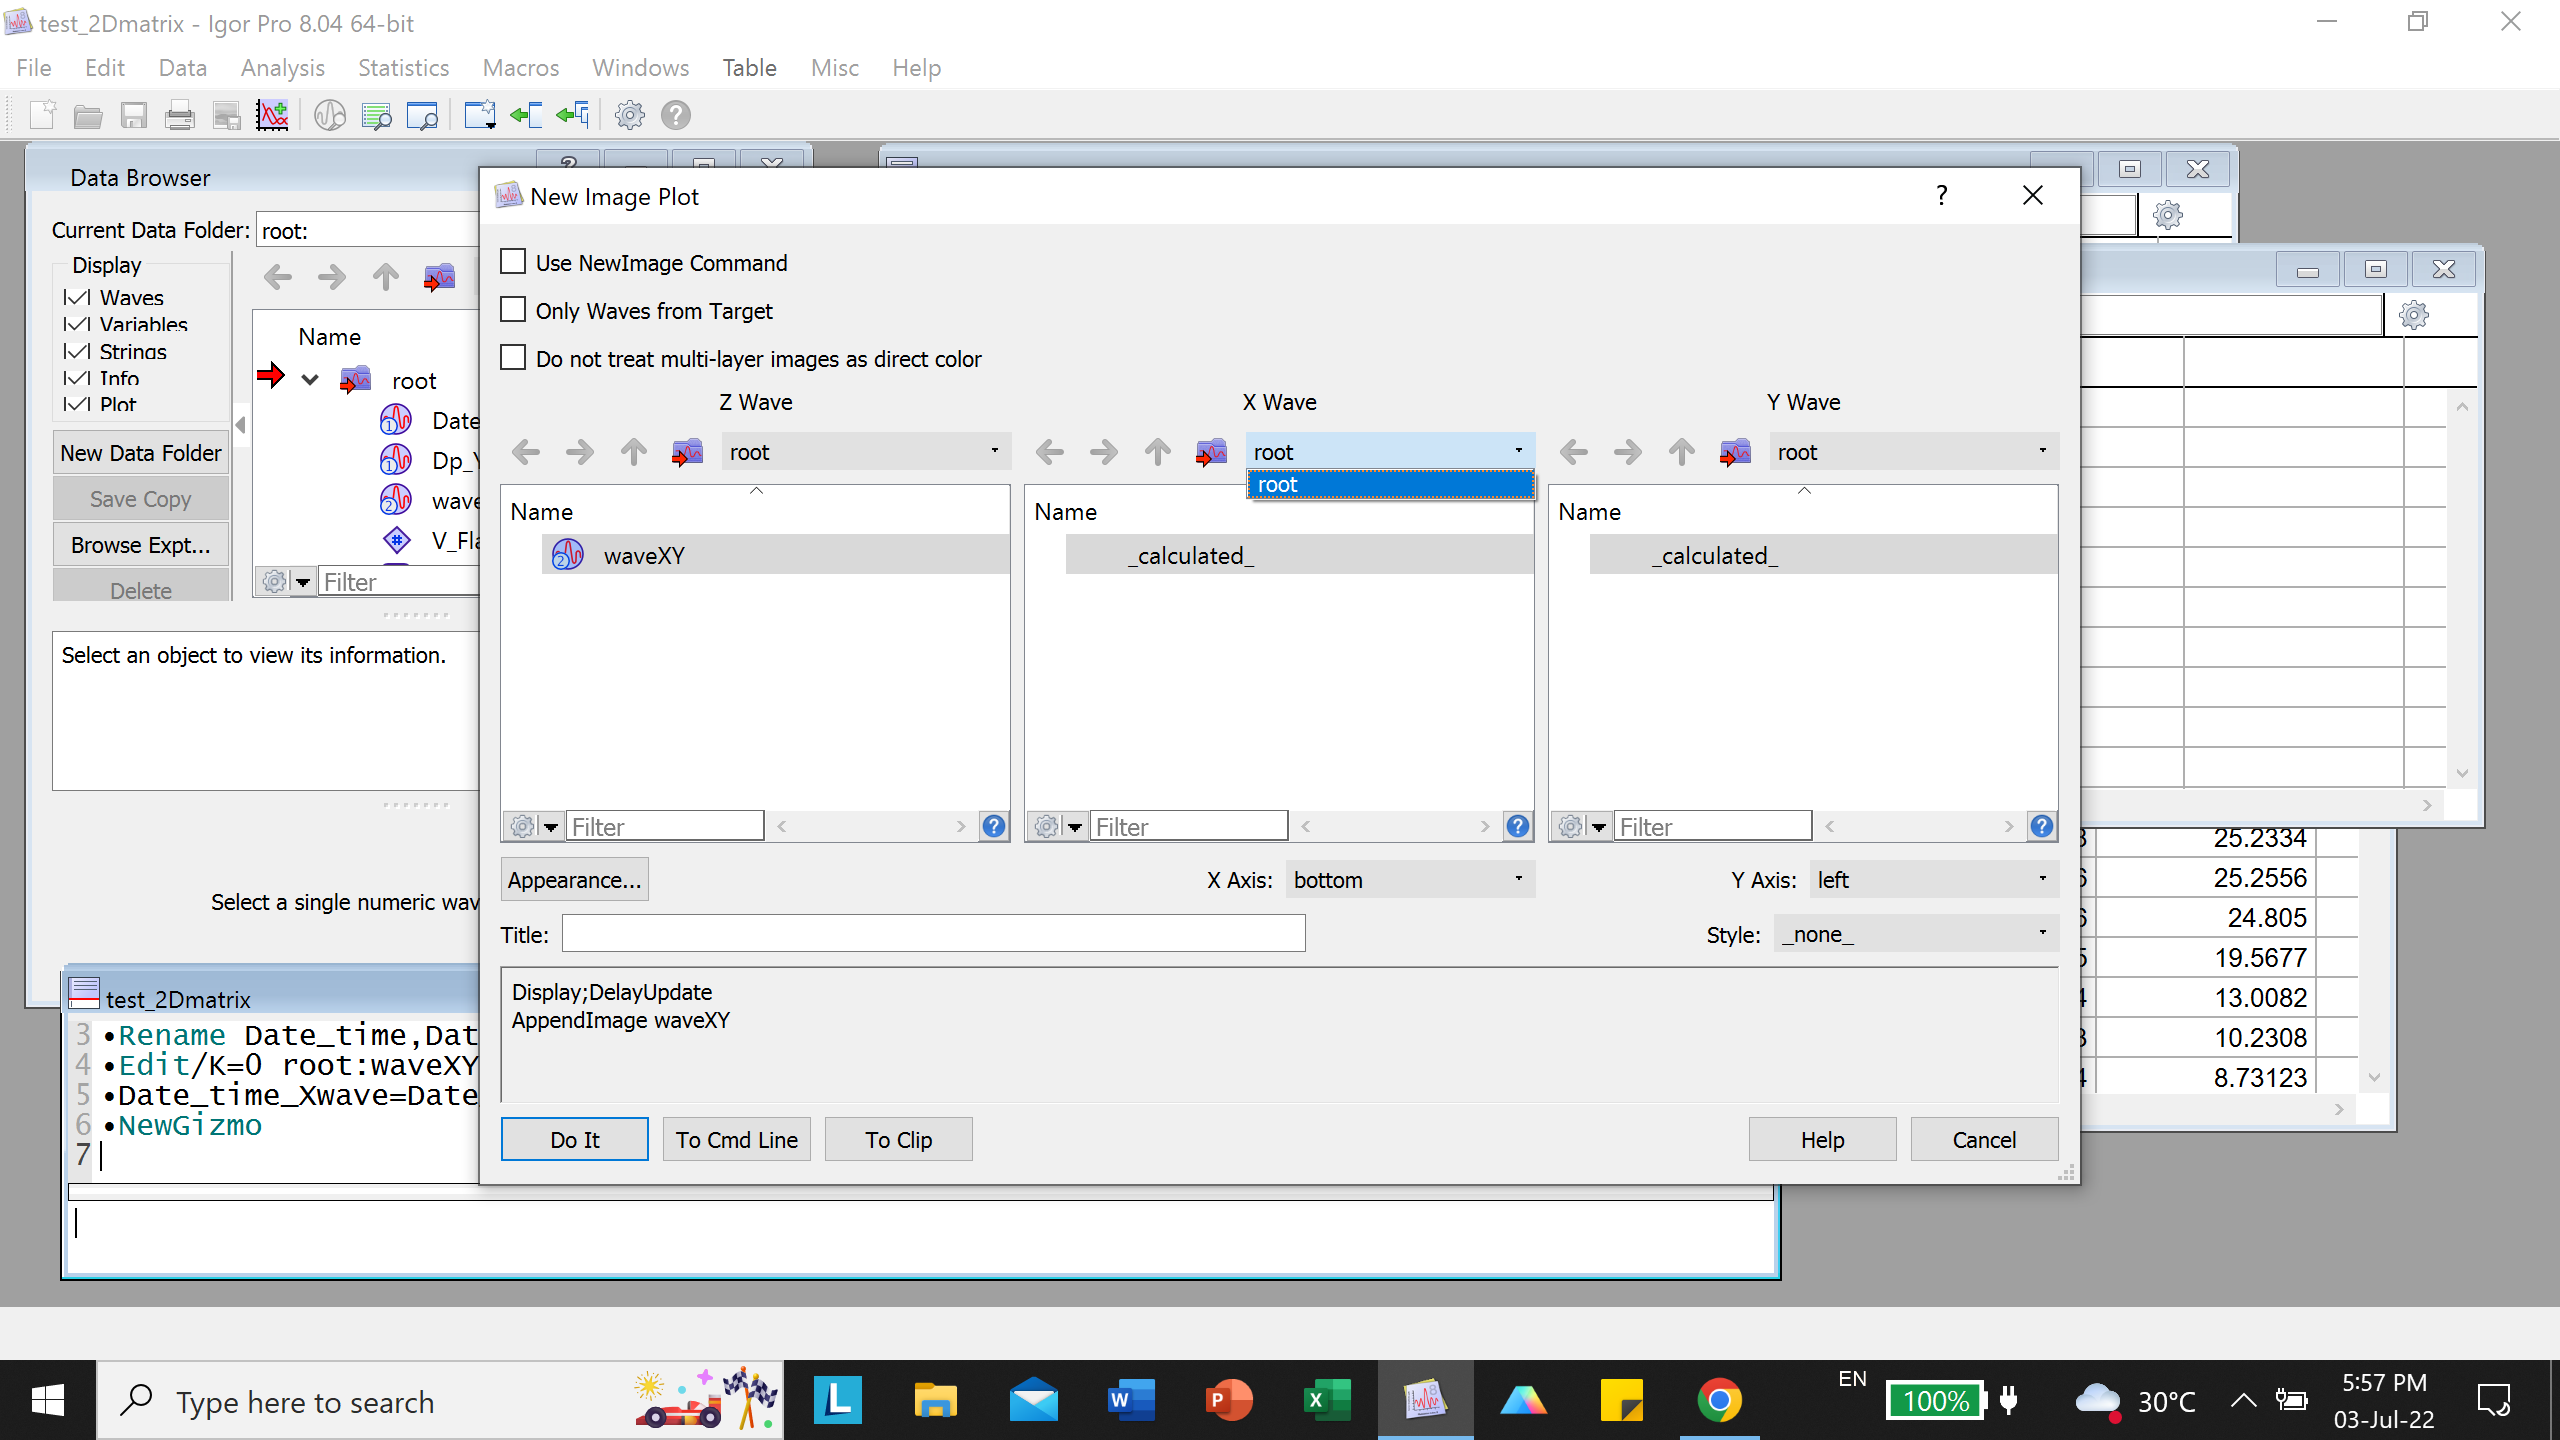
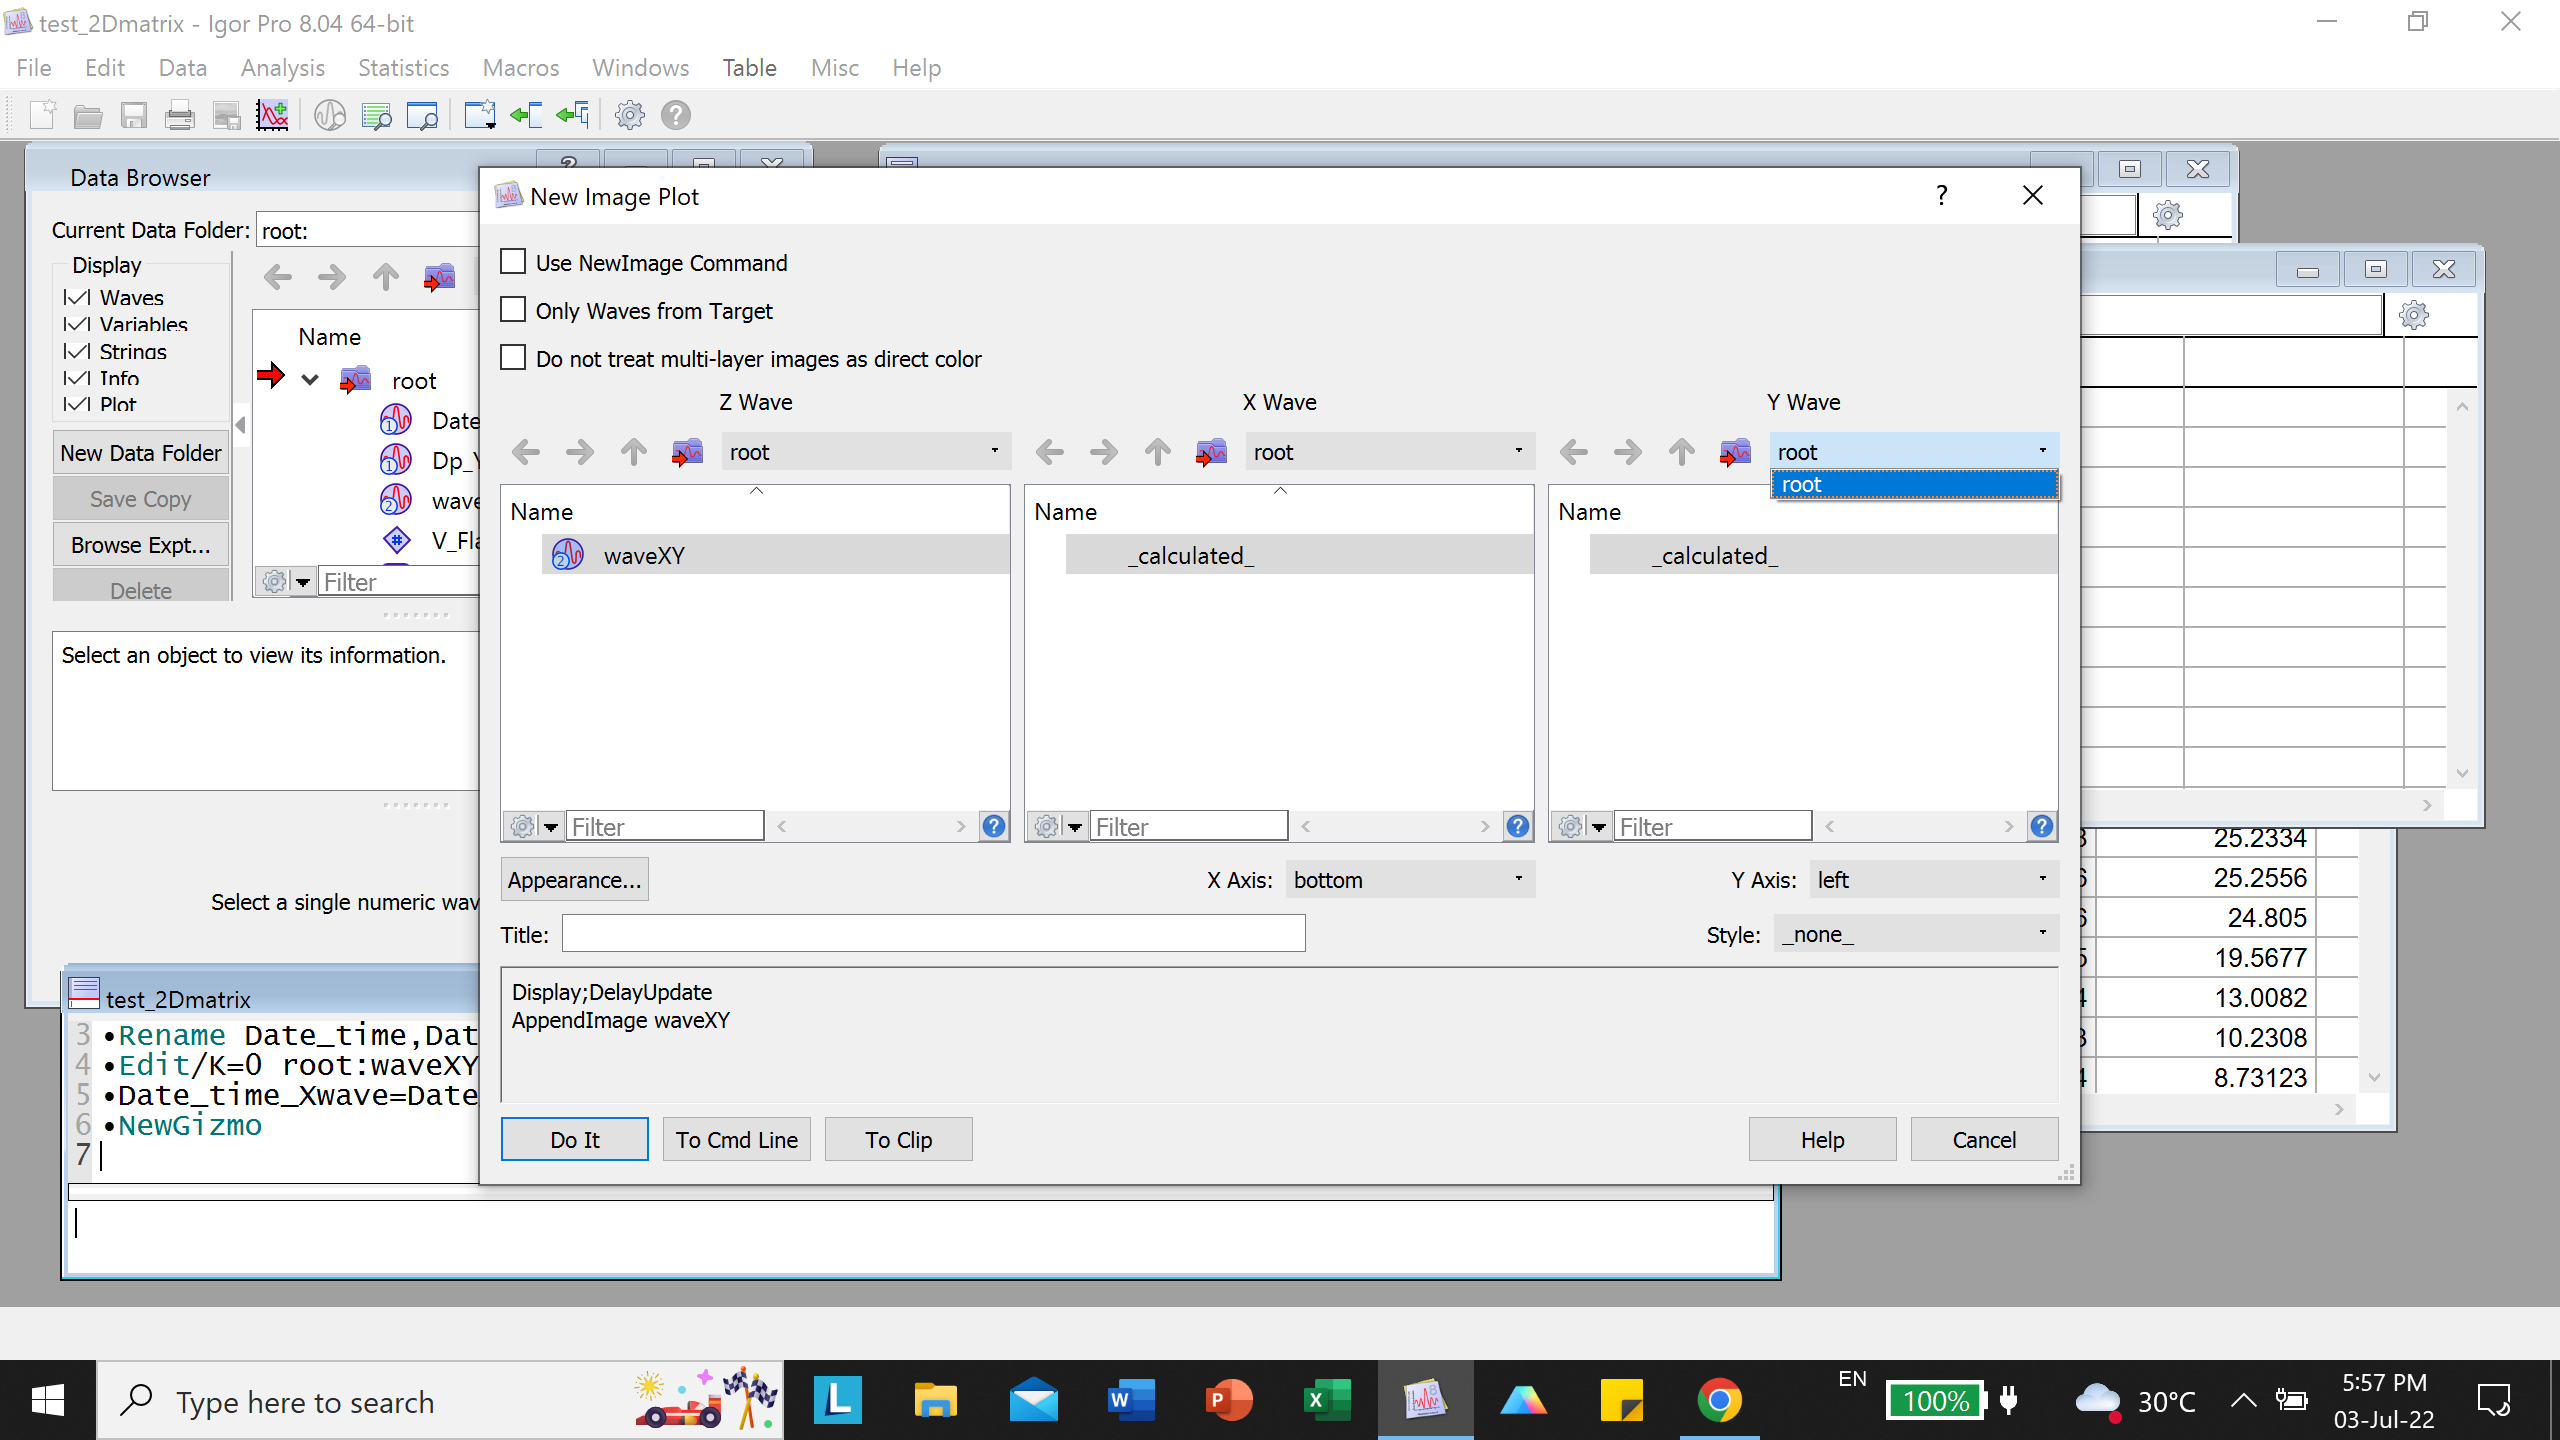
The answer is simple: Your X- and Y-axis waves need one point more than the respective dimension of the 2D wave, since the values determine the pixel edges of the image and not the pixel center. In short, waves with 2624 points and 26 points will show up in the selection. You can read more here:
July 3, 2022 at 06:26 am - Permalink
It works! Thanks for pointing out my mistake.
July 3, 2022 at 06:43 am - Permalink