Is plotting the initial guess a prerequisite to get a decent fitting curve?


I want to write a procedure to fit data automatically.
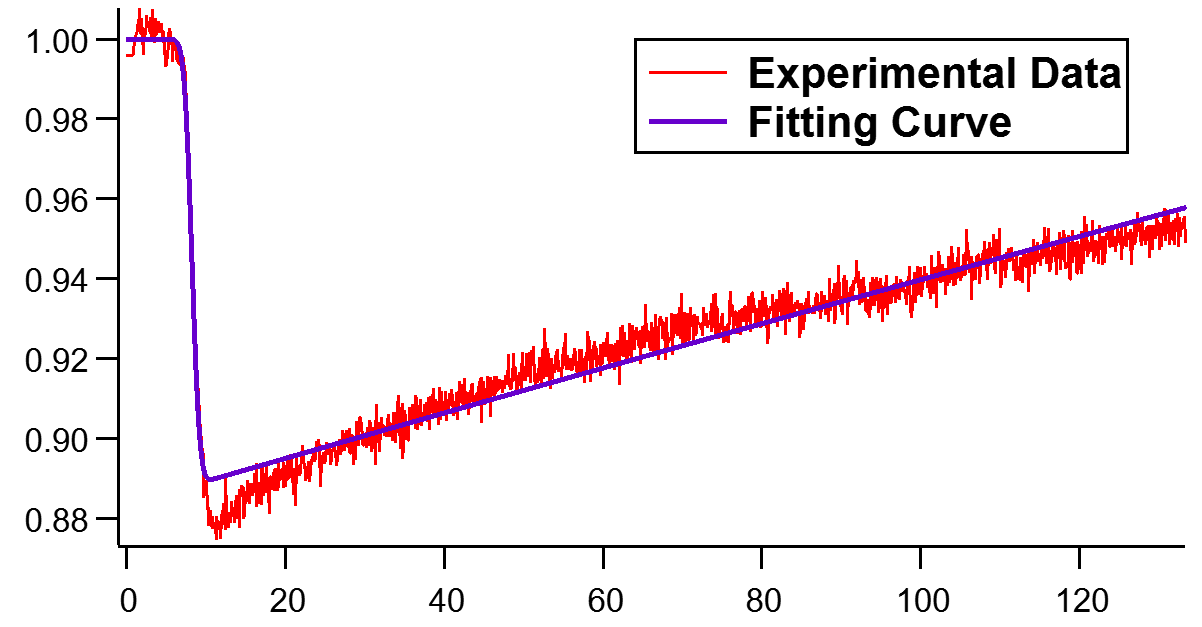
What I found is if I type the fitting function command directly in the Command Window, the fitting curve is far away from the experimental data. As shown in the first figure attached.
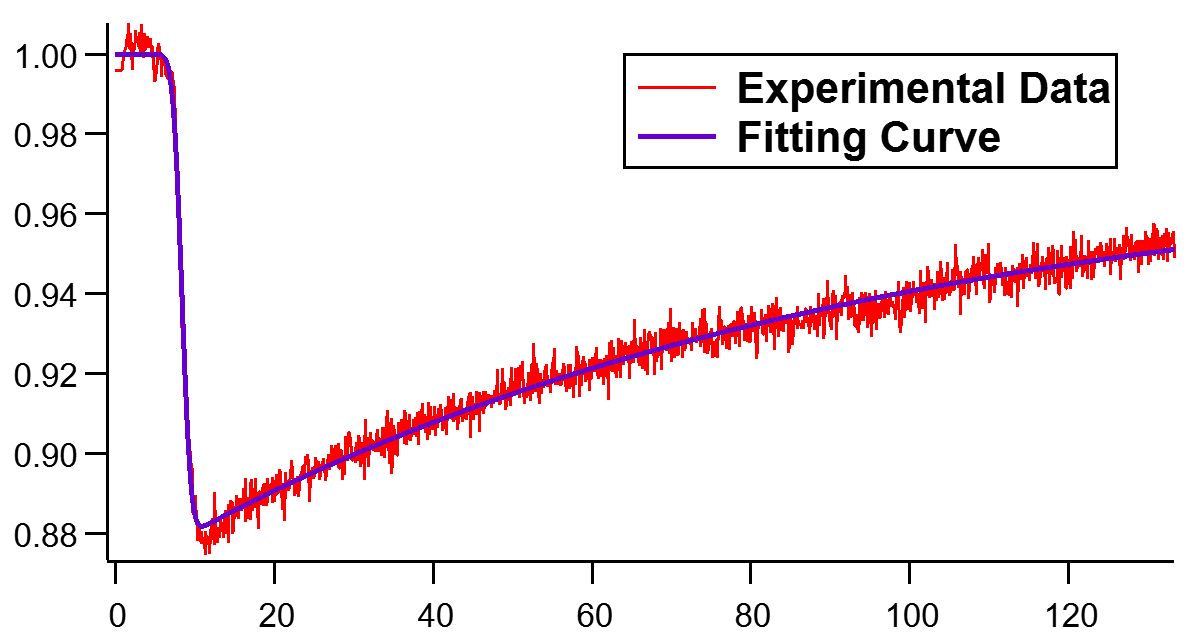
However, if I plot the experimental data first, click Analysis-->Curve Fitting--> select the fitting function, click "Graph Now", then click "Do It", the fitting curve looks much reasonable. As shown in the second figure.
It seems that plot the initial guess for the fitting curve is essential to get a reasonable fitting curve.
Is there a reason why this is happening?
If plotting the initial guess is a prerequisite to get a decent fitting curve, is there a way to plot the initial guess in the procedure window?
Thank you very much for any comments or thoughts!
The Graph Now button is simply a way to show you the curve you would get from the initial guesses entered into the coefficient list. The same initial guesses should give the same fit with or without the Graph Now button.
I assume you are fitting to a user-defined function.
What sort of initial guess do you provide in the case where you get a bad fit? Be sure your coefficient wave is double precision.
July 27, 2021 at 04:07 pm - Permalink
In reply to The Graph Now button is… by johnweeks
igornoob2017Yes, the fitting function is user-defined. But the building function, fExpGauss, is defined in <Multi-peak fitting 2.0> .
Thank you for your reminder about the coefficient wave. I tried to reset the W_coef wave before every fitting, and the weird thing disappeared.
I think what happened before was the W_coef stores the fitting results from the previous data set, which can be far away from the "correct" initial guess for the current dataset. And it will cause the problem that I described before.
Appreciate your help!
July 28, 2021 at 06:42 am - Permalink
Note that fExpGauss() is included in an obsolete part of Multipeak Fitting, which will not be loaded together with the Multipeak Fitting package anymore in Igor versions >= 9. The procedure file where this is in (Peak Functions.ipf) is still shipped with Igor 9, though. To keep using it you need to add the following line into the procedure window of each experiment you want to have it:
I rather recommend that you recreate this function with a distinct name in your own code and not rely on the existence of this old stuff anymore. It is just a very short piece of code. Or even better, write a proper implementation of the ExpModGauss function using the newer(?) erfc() function.
July 28, 2021 at 09:59 am - Permalink
Glad I could help.
Looks like your "bad" fit above found a local minimum in chi-square. Some fit functions require better guesses than others.
July 28, 2021 at 10:18 am - Permalink
In reply to Note that fExpGauss() is… by chozo
igornoob2017Thanks for sharing this detailed information, Chozo. I am using version8, but I will check the erfc function.
July 28, 2021 at 11:05 am - Permalink