[RESOLVED] Global Fit -- Weighting wave alters fit wave even when parameters fixed


Hi all -- currently racking my brain over this issue...
I'm using the Global Fit 2 package to fit a set of ~15 interlinked exponentials and double exponentials (a chemical kinetics problem). One of these is showing strange behaviour:
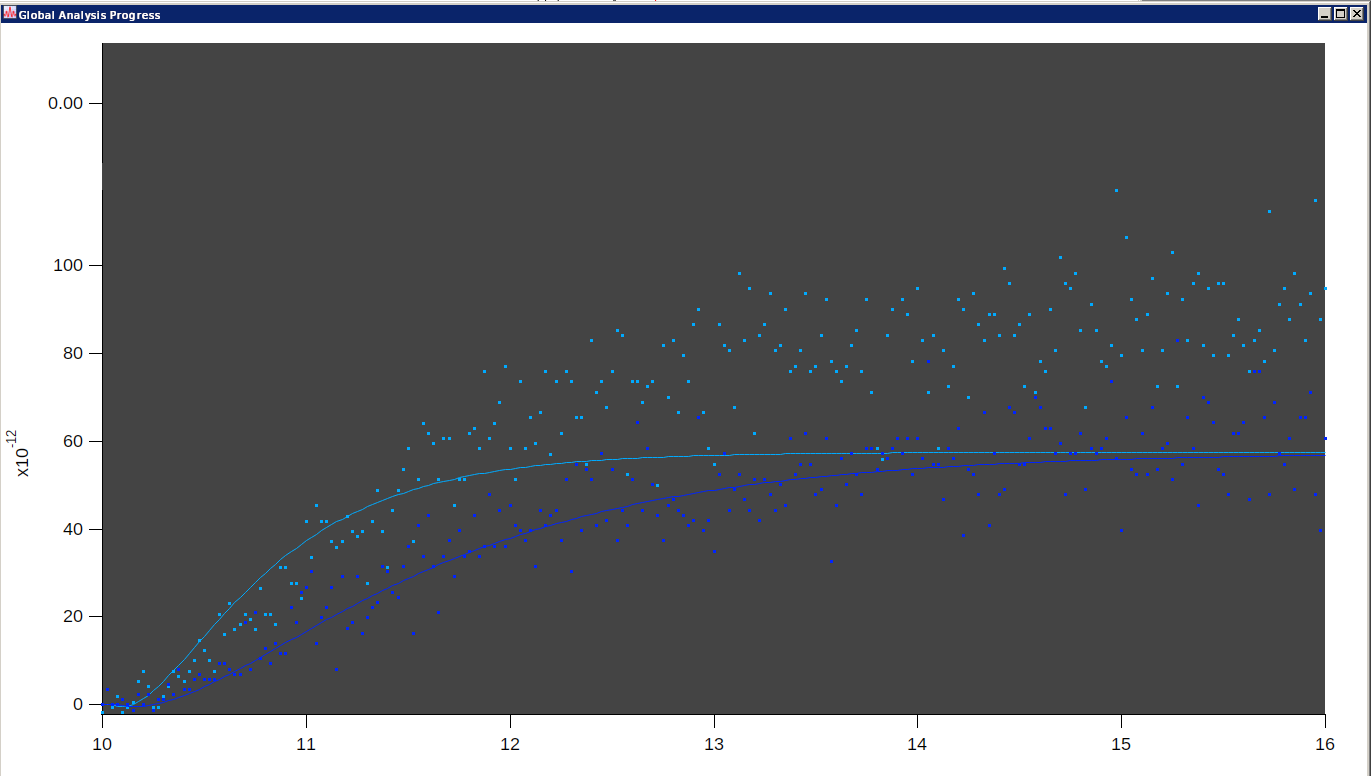
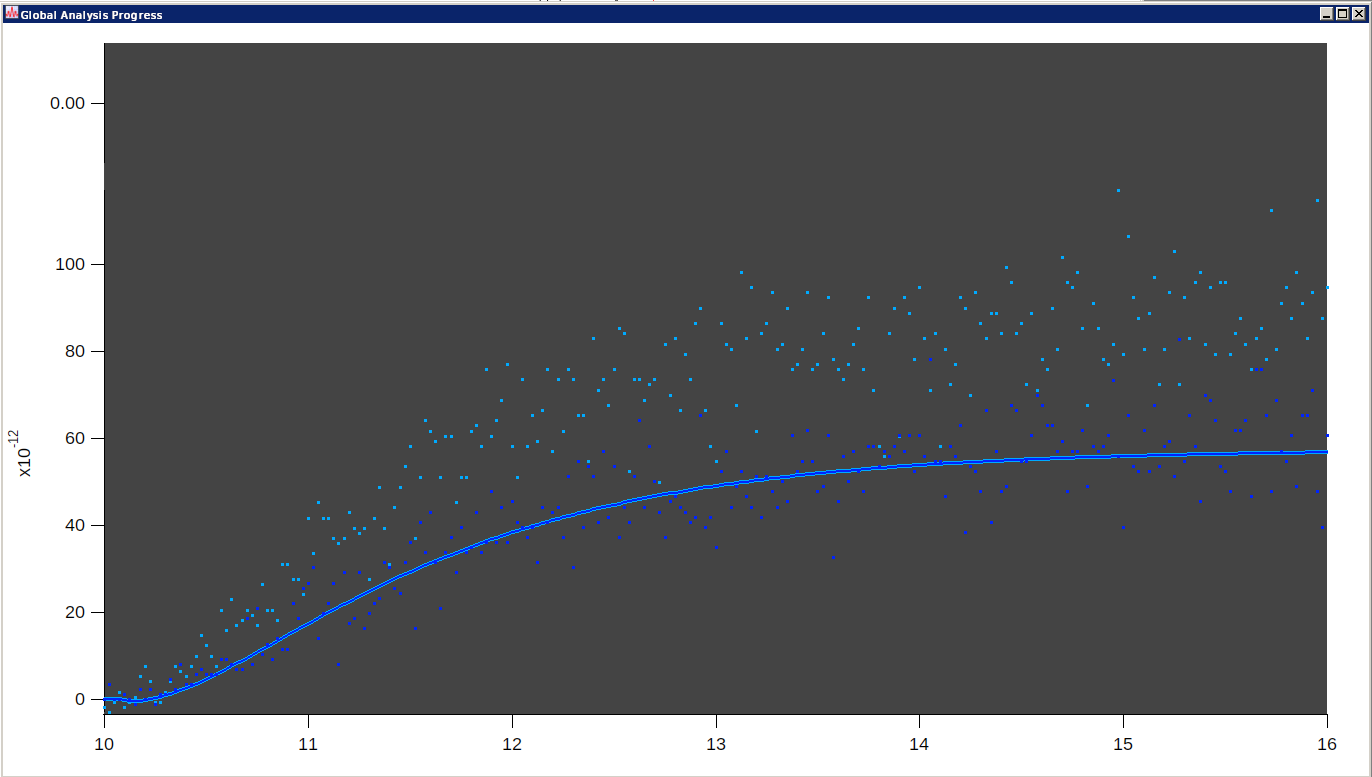
- Visually, a curve that "should" be a double exponential appears to be approximately single exponential (not including a convoluted instrument response function)
- When the parameters of one double exponential are fixed to be identical to another double exponential, the curves display differently
- This isn't just a visual error -- when freed, the values of the parameters of the fitted curve in question take unusual values
- When the weighting wave is not included in the fit, the issue vanishes (but I'd rather avoid this step if possible)
I'm not really sure what could be causing this? The weighting wave doesn't have any NaN values. Does anyone have any experience in this area?
Welcome to the forum. Would it be possible to post a minimal example experiment file? Maybe someone can imagine what might be going on just from your description, but I think you might have more luck if we could test things directly. Also, I assume you are using the latest version of Igor 9?
February 29, 2024 at 04:20 am - Permalink
To chime in after @chozo, I have to wonder if, in the process of doing your fits across batches of data curves, you have not somehow mis-named a source wave in at the next step in an iteration. By example, I would have to say that your second plot simply shows an attempt to fit the lower most data set twice, and the two curves are simply the natural outcome of uncertainties between experimental runs. IOW, your iteration at that point forgot to point the second fitting step to the upper wave. This is an administrative error in coding rather than a mathematical error in fitting.
Just FYI also, the future, please consider posting images where the data points and curves are not lost on the background.
February 29, 2024 at 08:37 am - Permalink
Those pictures are taken straight from the Global Fit result graph. I used colors to try to make the various different data sets easily distinguishable. Usually it looks better than that :)
I would approach double exponentials with great caution. Surprisingly large differences in the time constants for two exponentials look very similar to a single exponential when added together. When you add quite a lot of noise, as in your example, then the fits will do very strange things while wandering around in a very flat-bottomed chi-square surface looking for a minimum.
If you can't figure this out, please send a copy of your Igor experiment file that I can use to actually run your fit myself. That would mean any external procedure file that might exist with definitions of fitting functions and such, and the data waves and an already set up Global Fit control panel.
If your fitting functions use global variables or waves, there are lots of ways to get very screwy results in Global Fit. The Global Fit code doesn't tolerate global objects well. Having said that, I recently made some changes that haven't come out in a release yet that improve on that behavior.
February 29, 2024 at 09:46 am - Permalink
I just looked at those pictures in a larger format. I now see that they have a concave-up starting bit, then the exponential decay to a higher asymptote. Is that bit of a tail at the beginning part of instrument response, or is it part of the double exponential? If it is instrument response, and the exponential decay is expected to fit a double exponential, I will say that I see no support for two exponentials in that data.
February 29, 2024 at 09:50 am - Permalink
> Those pictures are taken straight from the Global Fit result graph. I used colors to try to make the various different data sets easily distinguishable. Usually it looks better than that :)
I have difficulties seeing the dark colored data points on the dark background. So, if I might suggest from what I (a blissfully ignorant soul) know about color spaces, it is not that the different colors being used for the different traces are nearly indistinguishable, it is that the hue used for the colors for the data points may be too close to black (the background color) rather than white. And/or that the data points themselves are small at the resolution in the screen shot.
Just some thoughts.
February 29, 2024 at 10:30 am - Permalink
Well, right. Usually you get bright colors on a dark background. In fact, I think some of the problem is from downsizing the images. If you click on one to view the image at more or less full size, they are better looking. Not great, but better.
February 29, 2024 at 05:00 pm - Permalink
Hi all, thanks for all the input!
Some clarifications:
Qualitative drawing of the model in question -- species "a" reacts to "b" which then reacts to "c", starting at time t0
Fitted waves become identical only when they have the same parameters AND no weighting present
For context, the full fit consisting of 15 different traces, 5 of each type
Just the "c" type traces, with the white one behaving oddly (yellow is cut off for display reasons, but is normal)
I'll see if I can put together a minimal experiment file that reproduces the issue (some of the files have a very large amount of data from which these plots are condensed)
March 4, 2024 at 07:10 pm - Permalink
Ok, this experiment file seems to reproduce the issue. Hopefully the comments aren't too sparse in the fitting function, sorry!
I've included two saved setups:
March 4, 2024 at 07:55 pm - Permalink
Thank you for the example experiment file. I couldn't cut through the details to solve your issue, but as a first microstep I tried to cut out a bit of clutter from your fit function. General tips:
Hope this is still useful for you. I could imagine the fit bugging out because of some step in the ChiSq landscape due to replacing NaNs with fixed values.
March 4, 2024 at 09:37 pm - Permalink
I looked at your experiment file, in more detail than usual since I'm training a new employee. I think the problem is the linkage of the K4 coefficient between your row 2 and row 5 data sets; when I unlinked them, the fit appeared nearly perfect. As far as I can tell, that coefficient controls the Model 1 decay amplitude, so linking those between two data set with different amplitudes would cause exactly the sort of problem you show where the two fit curves converge on the same asymptote for the two data sets that clearly have different values.
I am attaching a copy of your experiment file with my work.
March 5, 2024 at 11:05 am - Permalink
Thanks all again for taking a look at this!
Thanks for this! I'm definitely on the amateur/"type until it works" side of coding so now that these models are getting large enough that efficiency is becoming more significant etc. it's nice to have some declutter/polish tips :)
Thanks for the in-depth look -- however I fear I'm communicating my issue poorly! The "fit_linked" model that was visible in the file is there to illustrate the issue. I've deliberately (and unphysically) linked all of the coefficients for row 2 and row 5, such that these fits should be identical, as they have the same parameters. In this minimal example I'm not really worried about the accuracy of the fit. The trouble is, that unless weighting is turned off, the curves that display for the row 2 and row 5 fits aren't identical, when they should be. I believe this is indicative of a problem in row 2 specifically in the true model (also in the uploaded file, under "fit_normal") -- I first noticed the issue due to one of the coefficients (r2 K6) having an unusual value.
March 6, 2024 at 06:07 pm - Permalink
Update: I've been able to resolve the issue, though I'm still not exactly sure why it was happening! The weighting waves contained some zeros in the error due to the Poisson weighting which was of course unphysical, which I've now corrected. One specific zero value in the row 2 weighting wave seemed to be causing the strange behaviour for reasons that are beyond me, perhaps something deep in the code was diverging that shouldn't have... thanks again all for going through this!
March 6, 2024 at 11:51 pm - Permalink