Shading for X error bars
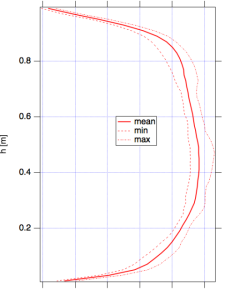
My graphs are not y = f(x) but x =f(y), where y is the height.
Is it possible to shade X error bars only? When I try, it seems that only Y error bar shading is possible. On the "Error Bars" window, it is written "X error Bars: Not Applicable".
For example in the attached graph, I'd like to shade between min and max curves.
That happens in the example of the manual:
Make/O/N=200 jack=sin(x/8), sam=cos(x/9) + (100-x)/30
Display /W=(64,181,499,520) jack,jack,sam
ModifyGraph lsize(jack)=0,rgb(sam)=(0,0,65535)
ErrorBars jack shade={0,0,(0,65535,0,10000),(0,0,0)},const=2
ErrorBars jack#1 shade={0,0,(0,65535,0,10000),(0,0,0)},const=1
ErrorBars sam shade={0,0,(65535,0,0,10000),(0,0,0)},const=1
Thank you in advance,
Best regards.


ModifyGraph swapXY=1?February 28, 2017 at 08:18 am - Permalink
Although I wonder if Igor developers forbade the X shade thinking in the XY swap option.
Have a good day.
February 28, 2017 at 11:30 pm - Permalink