Strange miter behavior

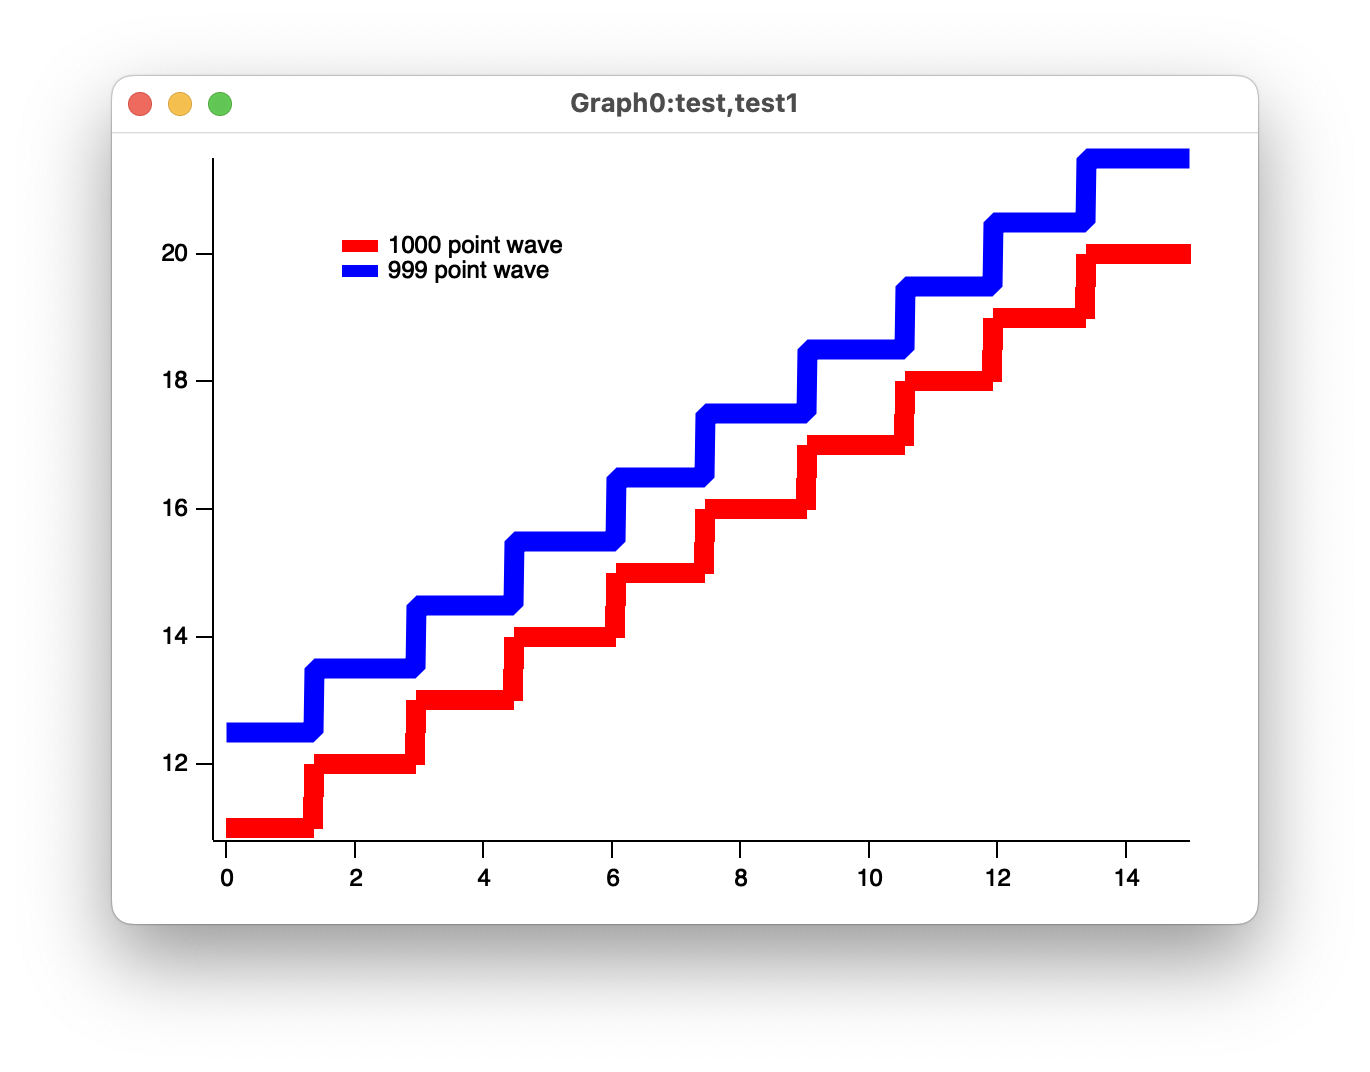
The graph shows two waves containing staircase-like patterns. Both traces have identical properties, i.e., line size 10, join style Bevel, miter limit 10, cap style Flat (which are the defaults). The only difference between the waves is the the red one has 1000 points and the blue one (offset vertically for clarity) has the last point deleted so that it has 999 points.

As can be seen, the blue wave shows the expected miter behavior whereas the red wave does not. In fact, no matter what miter/bevel/etc. settings I try for the red wave it remains the same as shown.

Any ideas of what might be going on here?

P.S.: When I saved the graph as a png file it actually looked as expected. So the issue seems to be a screen display issue. The image attached is a screenshot, not one saved from Igor as an image.

Staircase traces with 999 and 1000 points

It appears that the red trace is a bunch of individual line segments while the blue trace is a polyline. The number of points involved suggests some early work-around for graphics limitations. Would you be willing to send your examples to support@wavemetrics.com? I will see if I can find the cause.

Having gotten the requested example, I investigated and found that the problem was not a bug, but an optimization. Here is the answer I gave in response to the tech support query:

This was a tricky one- you are the victim of a method to speed up drawing on high-resolution displays. The original problem was that on a high-resolution display, drawing of lines-between-points mode graphs was much slower than on a standard definition display. It turns out that drawing a two-pixel-wide line takes something like an order of magnitude longer than a one-pixel line, and a trace with line width 1 is a two-pixel line on a high-res monitor.

The solution was to roll our own minimalist rasterizer for lines of width greater than 1 pixel, and in order to limit the impact, only for "large" traces, which was rather arbitrarily set to 1000 points. To make it very fast, all the niceties are gone- no antialising, no line joins or caps, etc.

The good news is that you can turn off the fast-draw mode:

SetIgorOption RawBitDraw=0

This good news is somewhat mitigated by the fact that you have to do that every time you start up Igor.
More good news, though- this drawing mode is used only when drawing on the screen; if you print or export a picture of the graph it will look as it was intended to look.

I think perhaps the fast-draw mode needs to be used more sparingly than it is now. Your example shows that for very wide lines, the results are really awful. Perhaps fast-draw should only be used when a trace is between 2 and 4 pixels in width or something like that, so that it is only used when the badness is less evident.

It should possibly be used only on request, but then we have to educate our users somehow that to get really fast drawing they need to turn on the fast-draw mode. I feel lots of tech support or IgorExchange queries would result. At the least, it should probably be a per-graph or per-trace setting, and that setting should be accessible in the Modify Trace Appearance dialog so that the user can decide for themselves on the tradeoff between speed and good looks.

If you want to see just how important this can be, do this:

SetIgorOption RawBitDraw=0
test=gnoise(5) // makes a very spiky trace

On my machine, the test trace goes from being not noticeably slow to being really annoyingly slow, I presume because the rasterizer has to compute all those bevels and fill them with anti-aliased pixels.

I have filed a bug ticket to look into making this all more nuanced.