is there any introduction to the "change wave scale" option
I found "setscale" is the relative command line, but the introduction of "setscale" does not give too much info on the window of "change wave scale"
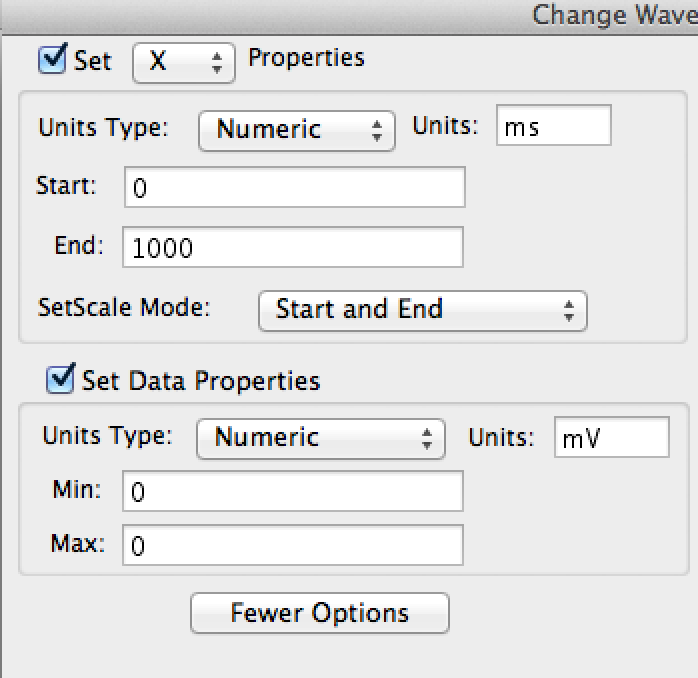
may I ask what does "start" "end" "min" "max" mean in the picture?
Sincerely
Geng
1_1.png
(50.93 KB)


Doing the first half of the guided tour is really essential for learning to use Igor. Choose Help->Getting Started to do the tour.
There is a further description of wave scaling here:
DisplayHelpTopic "The Waveform Model of Data"
The meaning of "end" is described at the beginning of the help for the SetScale operation.
For simplicity I recommend using the /P mode (SetScale mode = "Start and Delta"). In this mode you enter the starting X value and the delta X value. The other modes can be confusing.
July 10, 2014 at 05:13 pm - Permalink
First, as was already hinted, the start and end option can be used to get the start and delta X scaling without knowing the delta value. In this mode, delta is calculated by dividing the range by the number of entries. So, if you know the boundaries of your data rather than the increments use this mode.
What I wasn't aware of until today is that you can also scale the Y axis of the data and give it an unit. This has much less effect in Igor and I think it is not explained all too much and also rather invisible inside the program (for example not shown in the data browser). That's what the 'Set Data Properties' region refers to. The 'Min' and 'Max' values refer to the expected maximum and minimum Y values of you data (The real values don't actually have to obey this, though). The only use I found so far is the 'Full Scale' button inside the axis range tab of a graph, which sets the Y axis to these values. Is it just me, or is the documentation slightly lacking here? This could be a nice feature, but is stated may times as rather useless and explaining it's only purpose in a rather cryptic way.
Another thing on the X scaling (which I also just found out not too long ago): You don't need to use the command line or the menu to set (or adjust) the scaling. It can be done directly with the data browser by just rewriting the values inside the info window.
July 10, 2014 at 07:10 pm - Permalink
FYI, the Igor 7 Data Browser displays the "data" dimension as well.
July 11, 2014 at 06:22 am - Permalink
What I wasn't aware of until today is that you can also scale the Y axis of the data and give it an unit.
For me that's one of the really underrated features in Igor.
Generic code benefits heavily from the possibility to be able to query the data units of a wave.
July 11, 2014 at 06:54 am - Permalink