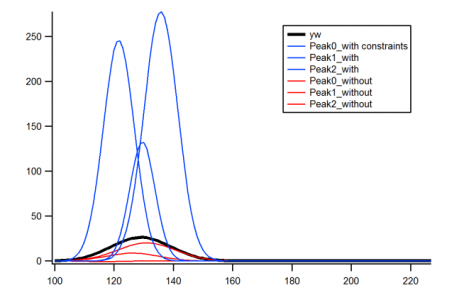
Weird stuff and better fit behaviour when providing a constraint wave
Last Friday I could only get a good fit by constraining my peak heights to > 0.
Today I seemed not to need that constraint, but I ran into a weird problem -- I found that constraining the order of peaks (ie a constraint wave with something lie "K4 > K7" in it) changed the fit results in an unexpected way. So I prepared a simple example using a sum of 3 Gaussians -- attached now.
After preparing the attached example, however, I ran into even more weird behaviour! Returning to my original Lorentzians, I could no longer see a difference by constraining K4 > K7...
What is going on? How can I ensure repeatable results from Igor?
(Bonus question -- my Igor plots are uglier since switching to a new windows PC, is there any way to fix this?)


But, wait, you say- how do I do that? And the answer is, use Make/D. The default (with just "Make") is single-precision. We perhaps confuse things a bit by causing the Make Waves dialog to generate a Make/D command by default, and if you don't notice that you may not be used to making certain of the /D flag.
Your peaks are heavily overlapped- a fit to a single Gaussian looks almost as good as your three-peak fit. That can lead to mysteriously erratic behavior because the fits sort of trade off- you can probably get a pretty good fit by moving one of the side peaks out along the tail of the middle peak while reducing the amplitude. That can leave the fit swimming around without strong guidance on where to go next.
Paradoxically, fitting fake data that has no noise can be problematic also because when you get close to the solution floating-point truncation errors may cause weird things to happen to the derivatives. But if your real data have peaks as closely spaced as your fake data, it will require very clean data without a lot of noise, as the noise will make the mysteriously erratic behavior even more erratic.
Finally, perhaps you have your own reasons for rolling your own peak fit function. I used Multipeak Fit 2 to fit your fake data:
John Weeks
WaveMetrics, Inc.
support@wavemetrics.com
September 18, 2017 at 03:57 pm - Permalink
Thanks a lot for the feedback.
I ensured that I am using make/D now...
I have been building my own fit functions since MPF2 (which is awesome) didn't allow me flexible constraints on my peak fitting. I ran into errors when specifying those constraints (ages ago, can't remember the details).
The other thing is that I need to "remote control" MPF2 and fit datasets automatically. I spent some time trying to figure out remote control but couldn't. I also want to display my results dynamically without discovering conflicting hooks in MPF2. Is there a package demoing these features, for example?
j
September 19, 2017 at 01:35 pm - Permalink
John Weeks
WaveMetrics, Inc.
support@wavemetrics.com
September 19, 2017 at 04:28 pm - Permalink
By the way, I just noticed that hiding graphs* was the reason I was getting a small error message in MPF2: a hidden notebook causes an error on a line
*Hiding graphs by Misc -> Miscellaneous Settings -> Miscellaneous -> Minimize Icon is Hide [enable]
September 20, 2017 at 09:02 am - Permalink
John Weeks
WaveMetrics, Inc.
support@wavemetrics.com
September 20, 2017 at 01:55 pm - Permalink