Why does rerunning function that creates a graph modify the existing graph?
Function CountvsPress (w0,w1, waveout)
    wave w0, w1, waveout
    string outwave
    Display w0 vs w1
    ModifyGraph mode=3,marker=8,msize=2,opaque=1
    ModifyGraph msize=1
    ModifyGraph marker=0
    ModifyGraph grid(bottom)=1
    ModifyGraph minor(bottom)=1
    duplicate/o w1 w1_test
    w1_test = w1_test*(x>4000)
    AppendToGraph w0 vs w1_test
    ModifyGraph rgb(w1#1)=(24576,24576,65280)
    duplicate/o w1 w1_test
    w1_test = w1_test*(x>7000)
    duplicate/o w1, $outwave
    wave waveout = $outwave
    display waveout
End
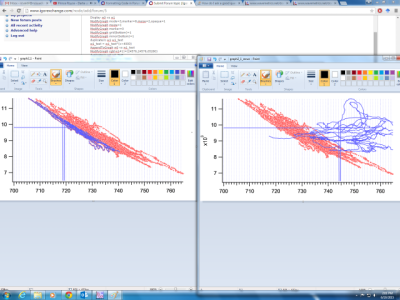
In the attached picture the graph on the left is the correct graph this is how I want it to look. The graph on the right is after the function is rerun. The blue data is different. The attached file is the data file I am using. I am very new to coding any help getting this to do what I want is appreciated.


Do you intend to make the wave w1_test twice?
And what is the role of the final Display command?
John Weeks
WaveMetrics, Inc.
support@wavemetrics.com
June 10, 2015 at 11:31 am - Permalink
The final display command was supposed to display the newly created graph which wouldn't be overwritten by a subsequent use of the function.
June 10, 2015 at 12:04 pm - Permalink
The trace isn't called w0#1, it is given a name that depends on the *actual* wave name. You can synthesize the trace name using something like
And in recent versions of Igor you can give a trace a name of your choosing using the /TN flag:
AppendToGraph w0/TN=trace2 vs w1At least that's how I recall it working :)
Sorry for my brain fart.
John Weeks
WaveMetrics, Inc.
support@wavemetrics.com
June 10, 2015 at 05:54 pm - Permalink
June 11, 2015 at 10:40 am - Permalink
duplicate/o w1 w1_testmakes a duplicate of whatever wave w1 points to, and calls the duplicate "w1_test". Every time you run the function, it makes the wave with that name and overwrites the previous one. You need to make a wave with a unique name, possibly like this:
If w1 refers to a wave called, for instance, "wave0", the call to UniqueName will generate a name like "wave1" or whatever unused name is next in that series. If w1 is called something without a number suffix, then the first time UniqueName will just add "0" to the name to make it unique.
John Weeks
WaveMetrics, Inc.
support@wavemetrics.com
June 11, 2015 at 11:04 am - Permalink