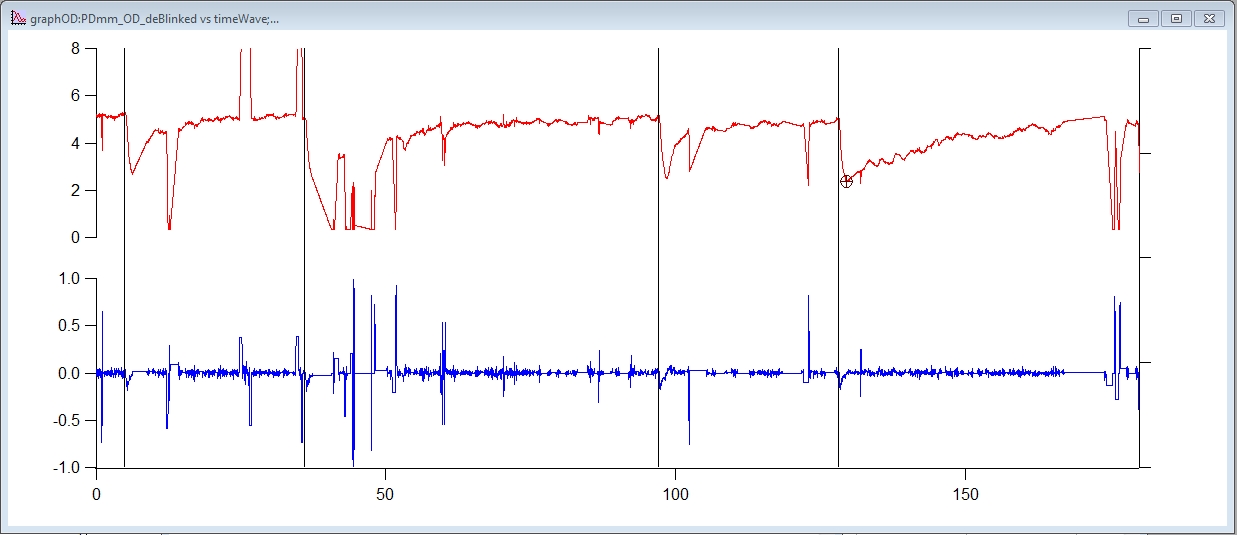
wrong graph demonstration during the program


The attached below is the macro script to analyze the pupil curve attached. The trouble that I have is as follows:
At the point of popup window:
string reviewInput
prompt reviewInput, "Is the curve analyzable?", popup, "Y;N"
DoPrompt "Reviewer inputs", reviewInput
I expect to see 3 plots on the graphOD, $pupwavename (red), $velwavename (blue), and stimMarker_y vs stimMarker_x (black). However, I could only see $pupwavename (red) on graphOD at each popup for "reviewInput". At the completion of the program, all contents are shown as the attached image file.
Would appreciate your insights. Thanks
====================================================================
//"Pupil constriction analysis": obtain pupil constriction parameters from deblinked waves
//obtain pupil constriction parameters from deblinked waves
menu "Macros"
"Pupil constriction", PupilConstrictionDialog()
end
function PupilConstrictionDialog()
wave timeWave, stimWave
string recEye
prompt recEye, "Enter the Eye recorded", popup, "OD;OS"
DoPrompt "Pupil constriction", recEye
if (V_flag)
return 0
endif
//create a table to demonstrate pupil constriciton parameters
string pupConstriOurput_name="pupConstriOutput_"+recEye
dowindow $pupConstriOurput_name
edit/N=$pupConstriOurput_name
string stimulus_name="stimulus_"+recEye
make/O/T $stimulus_name={"R1", "B1", "R2", "B2"}
appendtotable/W=$pupConstriOurput_name $stimulus_name
string BPD_mmName="BPD_mm_"+recEye
string peakConstri_mmName="peakConstri_mm_"+recEye
string constriAmp_mmName="constriAmp_mm_"+recEye
string constriAmp_perName="constriAmp_per_"+recEye
string constriLat_msName="constriLat_ms_"+recEye
string constriVel_avgName="constriVel_avg_"+recEye
string constriVel_maxName="constriVel_max_"+recEye
make/N=4/O $BPD_mmName //BPD
wave BPD_mm=$BPD_mmName
make/N=4/O $peakConstri_mmName
wave peakConstri_mm=$peakConstri_mmName
make/N=4/O $constriAmp_mmName //BPD-PDmin at peak constriction (mm)
wave constriAmp_mm=$constriAmp_mmName
make/N=4/O $constriAmp_perName //contriAmp_mm/BPD
wave constriAmp_per=$constriAmp_perName
make/N=4/O $constriLat_msName //time from the onset of the stimulus to the onset of the pupil contriction
wave constriLat_ms= $constriLat_msName
make/N=4/O $constriVel_avgName //average contriction velocity from the onset of the constriction to the peak contriction
wave constriVel_avg=$constriVel_avgName
make/N=4/O $constriVel_maxName //the max contriction velocity achieved
wave constriVel_max=$constriVel_maxName
appendtotable/W=$pupConstriOurput_name $BPD_mmName
appendtotable/W=$pupConstriOurput_name $peakConstri_mmName, $constriAmp_mmName, $constriAmp_perName
appendtotable/W=$pupConstriOurput_name $constriLat_msName, $constriVel_avgName, $constriVel_maxName
//pupil velocity wave is the differentated PDmm_deBlinked wave
string pupwavename="PDmm_"+recEye+"_deBlinked" //call deBlinked wave (pupwave)
wave pupwave=$pupwavename
string velwavename="PDmm_"+recEye+"_velocity" //velwavename is the 1st derivative (differentiation) of the deBlinked wave
duplicate/O/R=()pupwave, $velwavename
differentiate $velwavename
wave velwave=$velwavename
//make graph of PDmm_OD_deBlinked and PDmm_OD_differentiated vs. timeWave.
string graphName="graph"+recEye
dowindow/K $graphName
Display/N=$graphName $pupwavename vs timeWave
AppendToGraph/L=L2 $velwavename vs timeWave
ModifyGraph rgb($pupwavename)=(65280,0,0) //make PDmm_OD_deBlinked red color
ModifyGraph rgb($velwavename)=(0,0,65280) //make PDmm_OD_differentiated blue color
ModifyGraph axisEnab(left)={0.55,1},axisEnab(L2)={0,0.45}
ModifyGraph freePos(L2)={0,kwFraction}
SetAxis left 0,8 //scale PDmm_deBlinked 0-8 mm
SetAxis L2 -1,1 //scale PDmm_differentiated -1 to +1
//Mark stimulus onset with vertical lines and obtain pup contriction parameters
variable a //marker of the stim onset
variable b //marker of the peak constriction
variable c //beginnign of the pup constriction=the 1st constriciton velocity<-0.5
variable m //stimulus sequence 1-4, representing R1, B1, R2 and B2
string stimulus
for (m=0; m<=3; m=m+1) //define the initial a
if (m==0)
a=130
stimulus="R1"
elseif (m==1)
a=1060
stimulus="B1"
endif
if (m==2)
a=2890
stimulus="R2"
elseif (m==3)
a=3820
stimulus="B2"
endif
//create stimulus marker wave for R1, B1, R2, and B2
string stimMarker_x_name="stimMarker"+stimulus+"_x_"+recEye
string stimMarker_y_name="stimMarker"+stimulus+"_y_"+recEye
make/N=2/O $stimMarker_x_name
make/N=2/O $stimMarker_y_name
wave stimMarker_x=$stimMarker_x_name
wave stimMarker_y=$stimMarker_y_name
//Mark stimOnset
do
a=a+1
while (stimWave[a]==0)
stimMarker_x[0]=timeWave[a]; stimMarker_x[1]=timeWave[a]
stimMarker_y[0]=-1; stimMarker_y[1]=1
AppendToGraph/W=$graphName/R=R1 stimMarker_y vs stimMarker_x
ModifyGraph noLabel(R1)=1
ModifyGraph rgb($stimMarker_y_name)=(0,0,0)
ModifyGraph freePos(R1)={0,kwFraction}
//display R1 in graph0. If pupil wave is poor quality, discard and leave parameter empty
setAxis/W=$graphName bottom a/30-1, a/30+2 //zoom in to R1 pupil curve
string reviewInput
prompt reviewInput, "Is the curve analyzable?", popup, "Y;N"
DoPrompt "Reviewer inputs", reviewInput
if (V_flag)
return 0
endif
if (stringmatch (reviewInput, "Y"))
//acquire pup constriction parameters
WaveStats/R=[a-30, a-1] pupwave //wavestats of PDmm_deBlinked over 1s prior to stim onset
BPD_mm[m]=V_avg //BPD is the average of PDmm_deBlinked over 1s prior to stim onset
WaveStats/R=[a, a+60] pupwave //wavestats of PDmm_deBlinked over 1s following stim onset
peakConstri_mm[m]=V_min //peak pupil constriction in mm
constriAmp_mm[m]=BPD_mm[m]-V_min //constriAmp_mm=BPD-V_min
constriAmp_per[m]=constriAmp_mm[m]/BPD_mm[m] //constriAmp_perc=constriAmp_mm/BPD
b=V_minRowLoc //b is the point of max pupil constriction
//finding the onset of pup constriction, defined as the 1st of abs(velocity)>0.5
c=a
Do
c=c+1
While (velwave[c]>-0.05)
constriLat_ms[m]=(c-a)/30*1000
//finding the max pup constriction velocity
Wavestats/R=[c, b] velwave //wavestats of PDmm_velocity from stim onset to peak constriction
constriVel_max[m]=abs(V_min) //maximum constriction velocity
constriVel_avg[m]=abs(V_avg)
elseif (stringmatch (reviewInput, "N"))
BPD_mm[m]=NaN
peakConstri_mm[m]=NaN
constriAmp_mm[m]=NaN
constriAmp_per[m]=NaN
constriLat_ms[m]=NaN
constriVel_max[m]=NaN
constriVel_avg[m]=NaN
endif
endfor
//reset x-axis to full axis
setAxis/W=$graphName bottom 0.1, 180
end
My first thing to try in these cases is to do DoUpdate before I want to have graph available for user to look at. This should force Igor update the graphics (you can direct it to only that one window to reduce overhead). If that does not work, time to run it in debugger and see if all data are actually ready at the time you need to see them. I think they are, but this is lots of code to look through.
April 4, 2020 at 08:26 am - Permalink
Thanks--DoUpdate takes care it!
April 4, 2020 at 12:57 pm - Permalink