XYZ plot


I have a problem to do the same graph as in the "example" image.
I have N couple of (X,Y) waves all normalized (energy distribution and amplitude in the image) and one wave Z which have a size N.
I know how to plot my N (X,Y) couples :
        string xnames = WaveList("X*",";","")
	string ynames = WaveList("Y*",";","")
	variable i

 	display $(stringfromlist(0, ynames, ";")) vs $(stringfromlist(0, xnames, ";"))

	for (i=1; i<itemsinlist(xnames); i+=1)
		wave S=$(stringfromlist(i, ynames, ";"))
		S/=WaveMax(S)
		AppendToGraph S vs $(stringfromlist(i, xnames, ";"))
	endfor
And i obtain the image "XY", but i want make a depth effect with the last wave Z...
Do you have any idea ? Advices ?
I m sure it's simple, but I don't see the solution...
Thank you :)
The resulting matrix will let you show a 2D image plot with false-color Z display or a 3D Gizmo surface plot.
March 2, 2014 at 09:58 am - Permalink
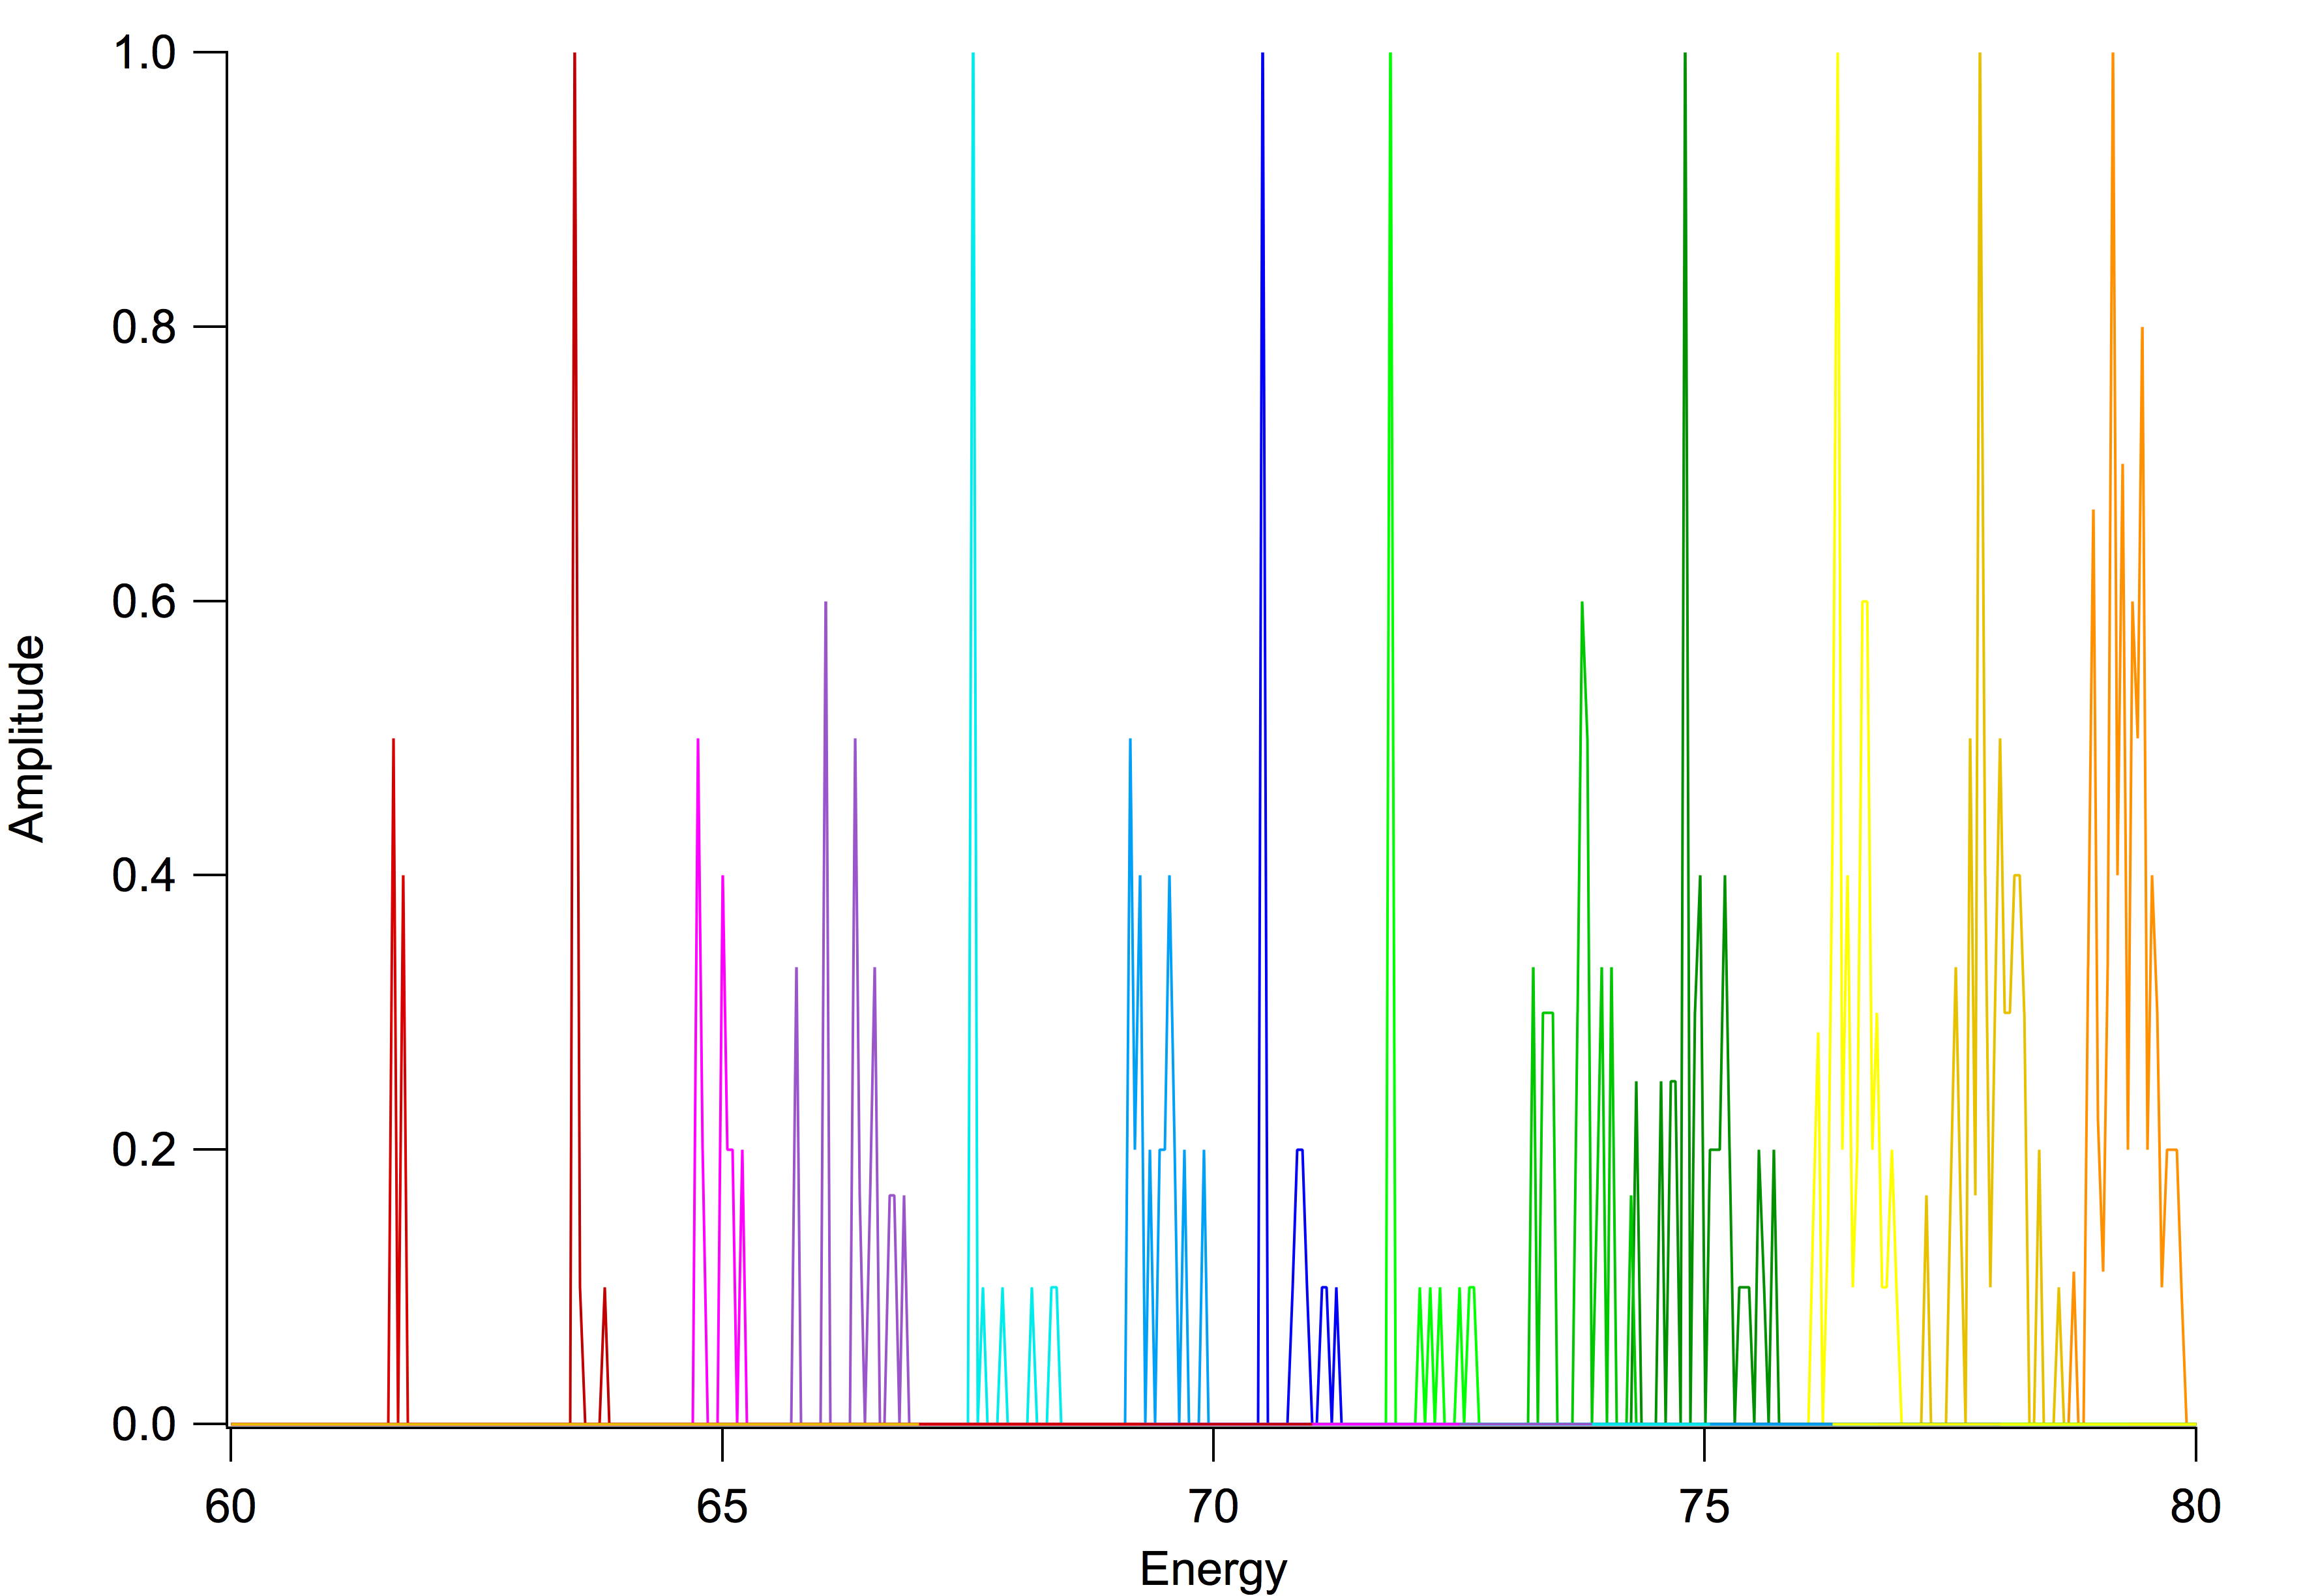
My experience consists to trace a kinetic energy spectrum for different values of voltage.
My data are 1D waves (I take names from "example" image) :
- N waves of energy (E1, E2, ..., EN)
- N waves of amplitudes for my spectrum (S1, S2, ..., SN)
- 1 wave of Voltage values (Dimension N)
Ei and Si have the same dimensions. If i just want a 2D plot : the "energy" wave E1 is the x coordonates for the spectrum S1 (y coordonates between 0 and 1 for all spectrum)
But my goal is to have all "spectrum (y), energy (x)" couples along a voltage axis (z). So, it's not a surface plot but a kind of multiple XY plot along a third axis.
Should I make a XYZ matrix ? how can I do that ? How can i exploit it ?
Thanks
March 3, 2014 at 01:25 am - Permalink
March 3, 2014 at 06:33 am - Permalink
March 3, 2014 at 07:42 am - Permalink