Curve fitting of 3D Gizmo plot (3D Scatter plot)


We perform curve fitting of the 2D plot by following: Analysis->Curve fitting->.......
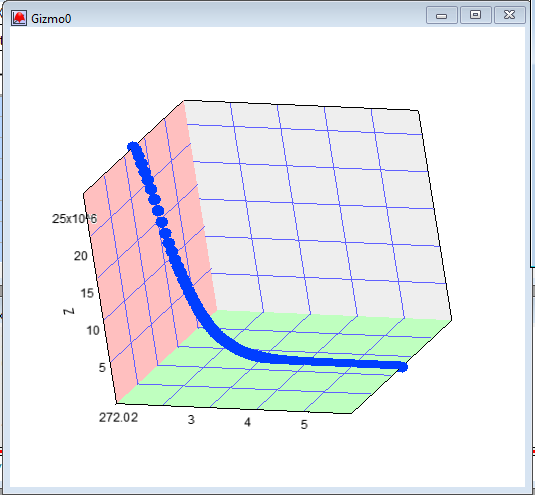
How can we perform curve fitting of the same curve in Gizmo plot? I want to fit the curve given in the figure by user defined function. Please tell me how can I do that.
Thanking in advance
I just sent you a reply to your tech support query on the same topic, but you didn't attach the picture.
Even fitting a 2D plot, you aren't really "fitting a plot". You are doing a fit to the data in the plot. That applies also to the Gizmo plot. Indeed, there are some connections between a regular XY plot and the Curve Fitting dialog that aren't present for a Gizmo plot. But you can still do the fit.
Perhaps you can share with us the fitting function you want to use, and a copy of your Igor experiment file containing that data and the Gizmo plot. Or if you are not comfortable sharing your data, send the experiment file attached to a reply to the tech support query.
February 23, 2021 at 02:35 pm - Permalink