How to find each unique rise and fall of a 'square wave' like data


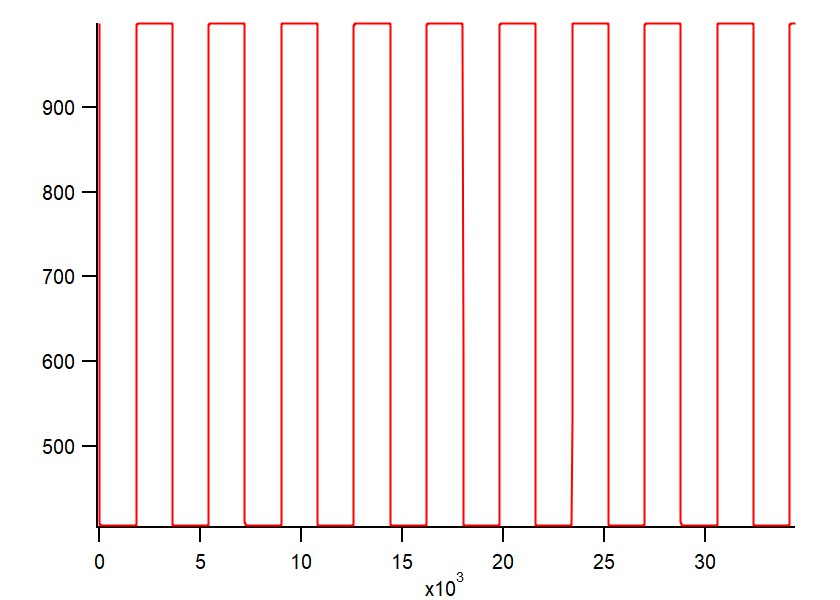
Hi all, I am trying to get the individual chunks of data that span from the first drop to the next rise. I would like to analyze each chunk to do curve fit, and plot separately. I was hoping to iterate through them in a for loop and hoping to find a way to find the index of those points.
Any ideas? I have looked at Extract and FindLevels but not sure how to use the results of those operations as input to the loop.
Thanks

Forum

Support

Gallery
Igor Pro 10
Learn More
Igor XOP Toolkit
Learn More
Igor NIDAQ Tools MX
Learn More
FindLevels is what you want: it outputs the point numbers where the input transitions though a threshold value (your data's average value in your case).
Then your problem reduces to "how to analyze a section of a wave", and we don't know what analysis you intend.
February 6, 2019 at 09:41 am - Permalink
Thank you!
February 18, 2019 at 08:22 pm - Permalink