Split Axis of Box Plots in Igor 8.0.3.3


Hi everyone,
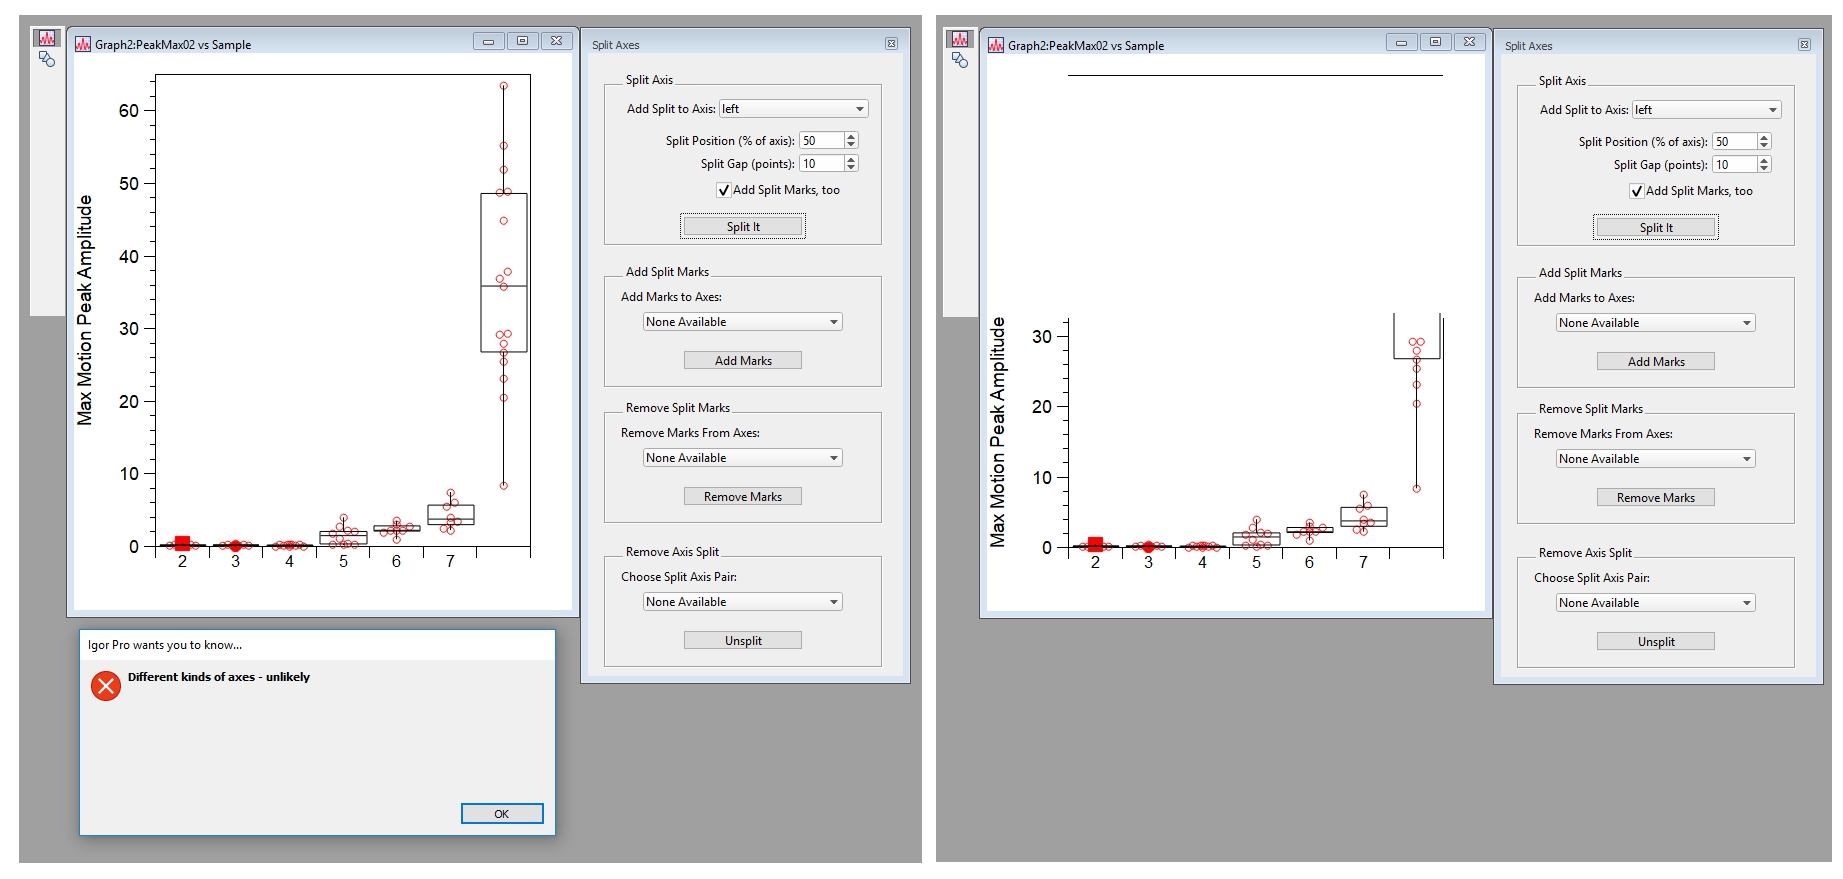
In using the split axis function with box plots produced by Igor 8 I get a message saying "Different Kinds of Axis - unlikely" and a chopped off graph (image attached).
Any chances that it will be possible to do it in the near future?
Many thanks,

Forum

Support

Gallery
Igor Pro 10
Learn More
Igor XOP Toolkit
Learn More
Igor NIDAQ Tools MX
Learn More
The way SplitAxis works is to get trace information for all the traces associated with the axis being split, then the package re-plots all the traces a second time on another axis. It leaves the original axis shortened with the axis range adjusted, and does the same with the split axis plot.
Unfortunately (but I'm not sure there is much I could have done when I implemented box plots) box plots are a different kind of trace requiring a different set of commands, so the existing Split Axis doesn't work with box plots (as you have found, of course). In fact, it would require a significant effort to make it work, so not soon. I will add it to my to-do list.
The error arises from the fact that an axis only exists if it has some trace, image, contour plot, etc., associated with it. Since Split Axis doesn't find anything it understands attached to that axis, it doesn't create the new axis and the code that tries to use that axis fails.
Split Axis doesn't do anything you can't do manually, it's just faster and easier to let the code handle all the complexity. The manual steps would be:
1) Graph->Append to Graph->Box Plot; make the same box plot again, but use Left Axis something like "Left_P2"
2) Graph->Modify Axis, Axis tab; set Draw Between for the two left axes appropriately. Set Free Position for Left_P2 to Fraction of Plot Area, 0 %. Set axis ranges however you want them.
3) Apply styling to axes, box plot, etc.
Laborious but do-able.
June 14, 2019 at 09:51 am - Permalink
In reply to The way SplitAxis works is… by johnweeks
rhjpiresHi John,
Thanks a bunch for the explanation and guidelines on how to do it manually.
I was instead thinking of using an image editor, but will give a try to your suggestions.
Thanks again!
R.
June 14, 2019 at 11:19 am - Permalink
Well, I was interested to find out just how hard this is going to be, so I plowed into it.
It's hard.
June 14, 2019 at 11:20 am - Permalink
In reply to The way SplitAxis works is… by johnweeks
rhjpiresJust to say that I find the implementation of the Box Plot functionality in Igor 8 is really quite well done, and I guess it was long awaited by many users. There's a lot of flexibility to edit the plots and I especially appreciate that it is possible to show the mean together with the median, and you can choose the whiskers to be StDev or percentiles. The only pity is that it is not possible to edit the properties of individual datapoints (such as colors), or of the a subset of datapoints such as those belonging to a single wave - but i guess that comes from the constraints inherent to Igor itself.
cheerio ad thanks again!
R.
June 14, 2019 at 01:49 pm - Permalink
Well, that was nice!
The only pity is that it is not possible to edit the properties of individual datapoints (such as colors), or of the a subset of datapoints such as those belonging to a single wave - but i guess that comes from the constraints inherent to Igor itself.
Coming in Igor Pro 9.
June 14, 2019 at 01:58 pm - Permalink