To find a series of Maxima


Hello
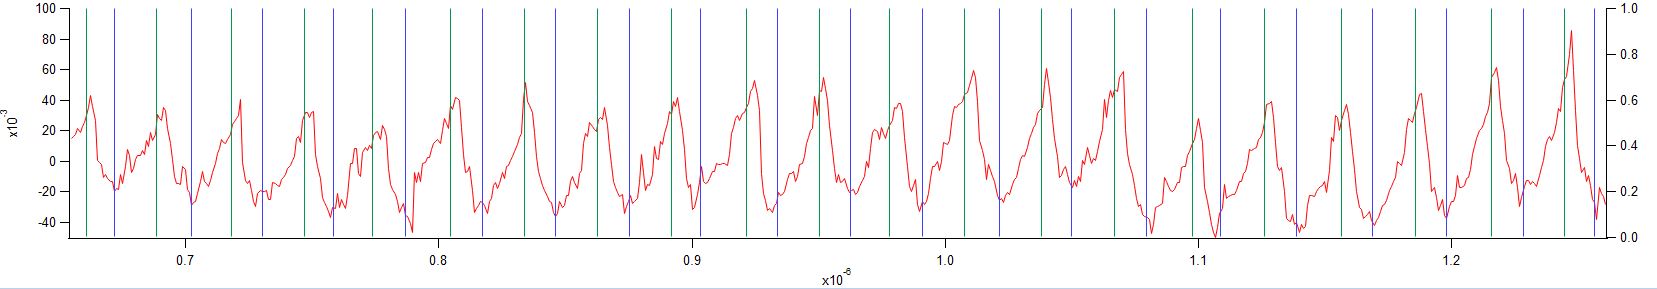
I have data for which I would like to determine the width of the pulses from valley to peak, for all pulses in the data. So I need to know X of the minimum and X of the maximum. The pulses are asymmetric, which is why smoothing, differentiating, and finding 0 levels comes with an inaccuracy (please see example).
The valleys are acceptable to me, but the so determined peaks have to much offset. Obviously this is due to the smoothing. And I have tried various smoothing approaches, but non leaves the max where it really is.
Can you think of another approach to determine (mainly) the Xs of the maxima? Maybe an asymmetric peak fit?
Many thanks
Remo

Forum

Support

Gallery
Igor Pro 10
Learn More
Igor XOP Toolkit
Learn More
Igor NIDAQ Tools MX
Learn More
in the mean time I just thought I could do wavestats on a range defined by to valleys. This works well.
February 4, 2020 at 12:52 am - Permalink
Could you smooth the data, differentiate it and look for crossings of zero in positive and negative directions? Do you have to use the peak and valley positions? You could look for the positions of the maximum positive and negative slopes instead. That might shift less when you smooth the data.
Fourier transforming the data might also be helpful if the pulses are all in registry with each other, meaning there is no phase shift over time.
February 4, 2020 at 02:40 am - Permalink
You could also do some version of highpass and lowpass filtering. Below is an extremely simplified example:
February 4, 2020 at 03:10 am - Permalink
Thanks,
currently I am satisfied with the following approach:
February 4, 2020 at 03:24 am - Permalink
Presuming the period is constant, you could fit a sin or cosine wave equation to the data.
y = A*sin(2*Pi*w*(x - xo))
This approach will give you an average period w and its uncertainty.
February 4, 2020 at 12:06 pm - Permalink
Here is another approach to consider that is based on template matching:
Choose a "typical" pulse and match it against the full wave. Here is what I did:
The last wave is pretty easy to analyze.
AG
February 5, 2020 at 05:21 pm - Permalink