McCabe-Thiel Plot Demonstration

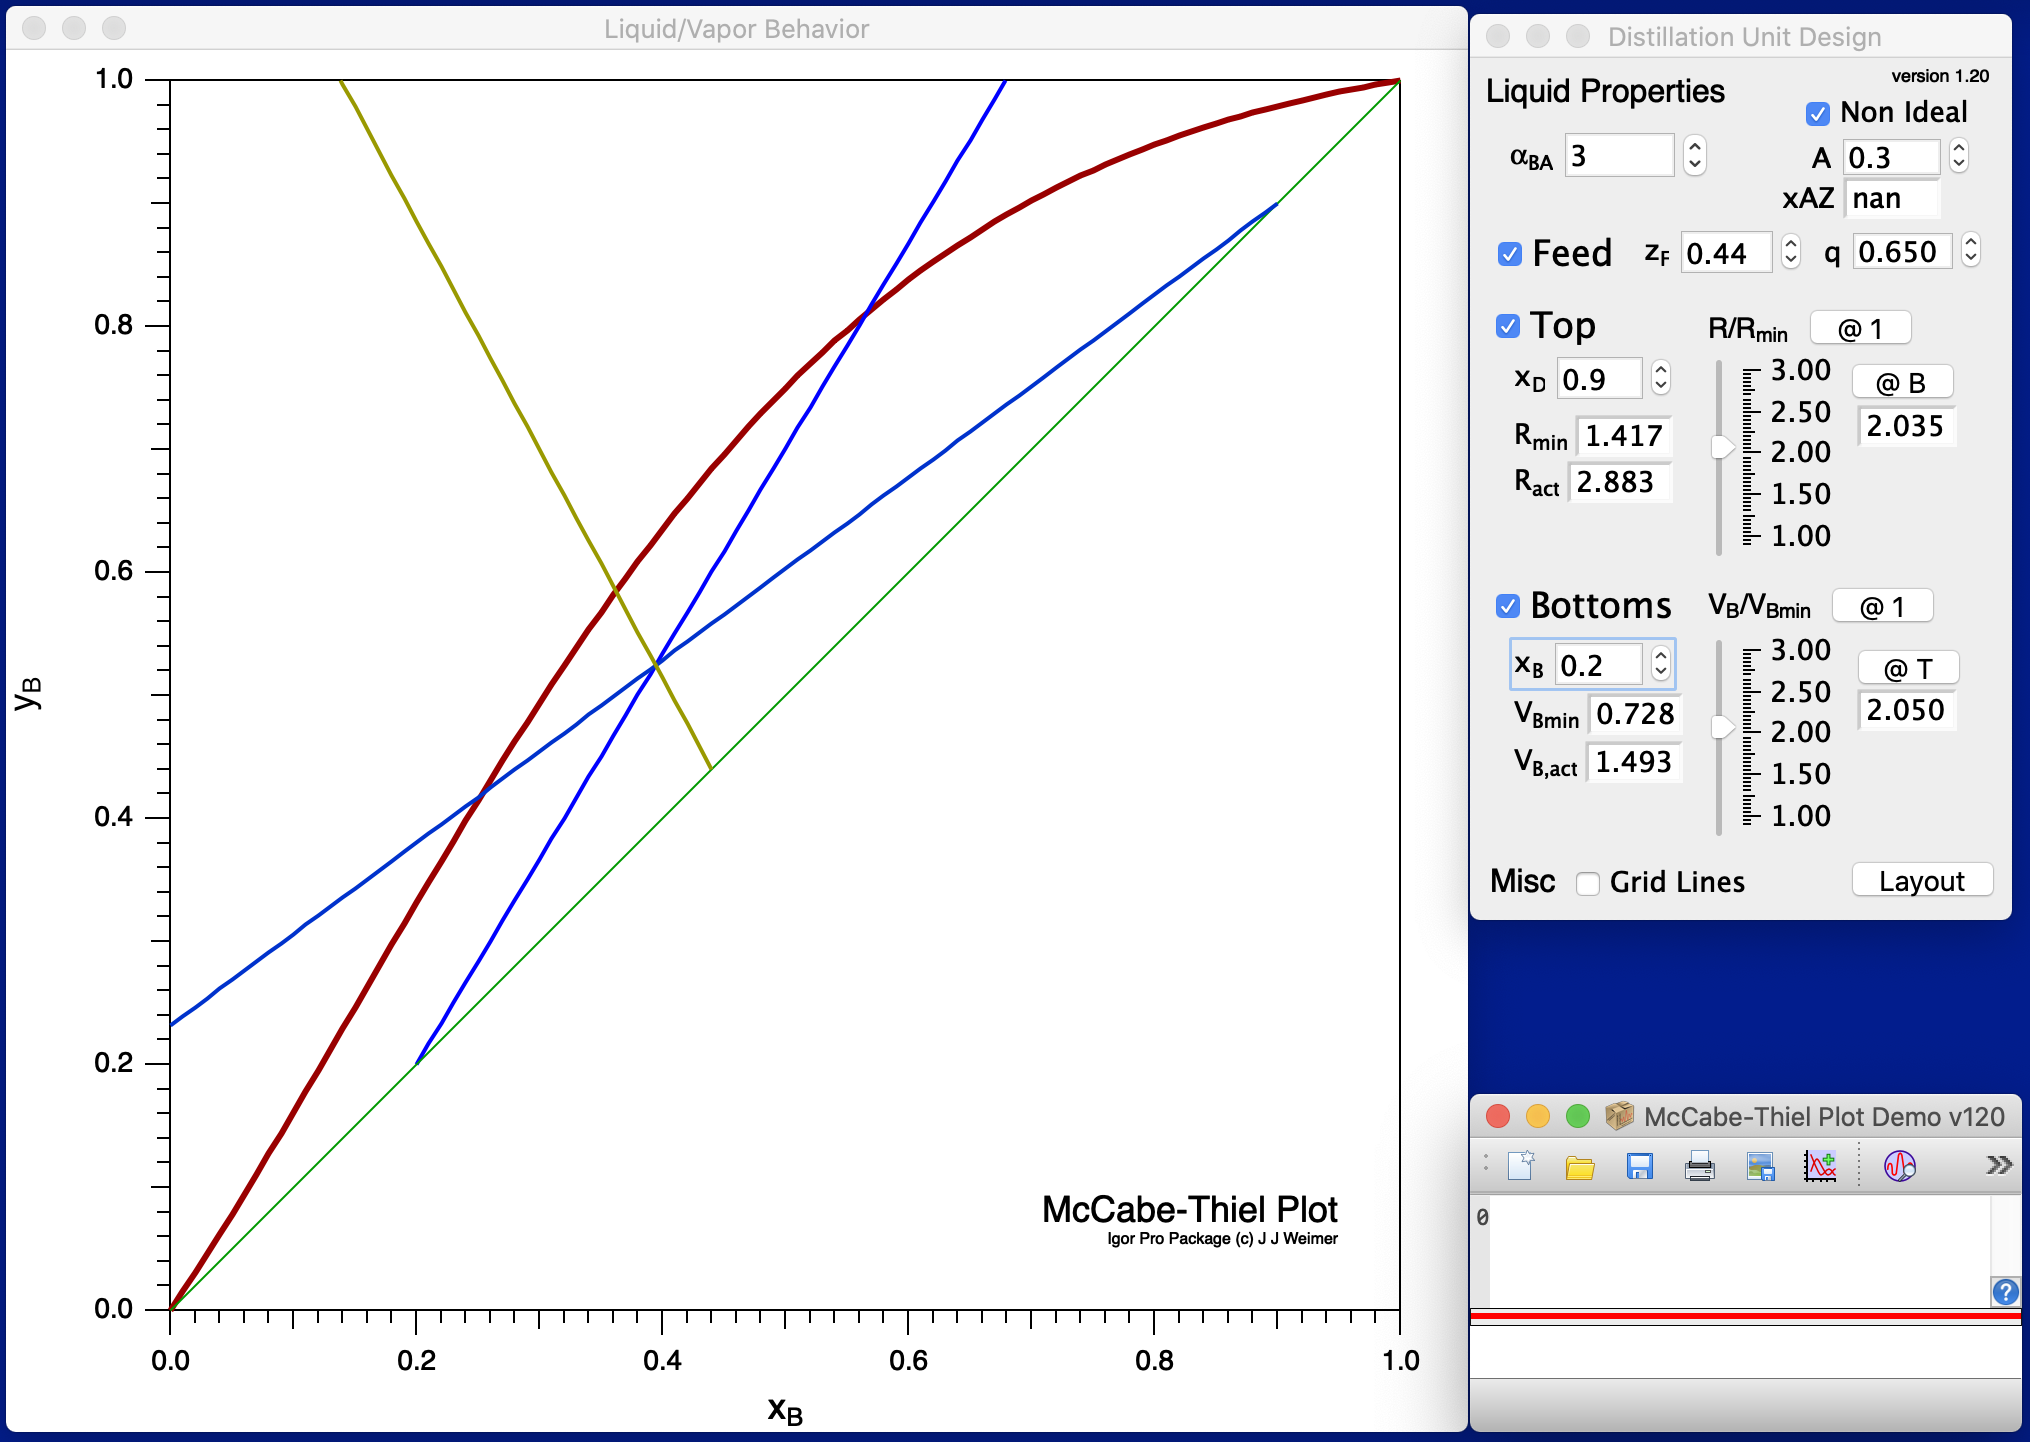
This project is a demonstration for a McCabe-Thiel plot in distillation. The user inpust values on a panel to control the positions lines as below.
- Set the shape of the equilibrium line using the relative volatility and the single-parameter Margules activity factor.
- Set the input feed position and q-line value.
- Set the distillate output composition. Set the relative reflux ratio as a factor over the minimum. Pin the relative reflux ratio at unity or to intercept the bottom at the feed.
- Set the bottoms output composition. Set the boil-up ratio as a factor over the minimum. Pin the boil-up ratio at unity or to intercept the bottom at the feed.
- Add grid lines to the plot or output the results to a layout to print or export.
Steps are currently not calculated. No help or other information is currently provided.
Images:
Project Details
Current Project Release
| Release File: | McCabe-Thiel Plot Demo v120.zip (39.13 KB) |
| Version: | 1.20 |
| Version Date: | |
| Version Major: | 1 |
| Version Patch Level: | 20 |
| OS Compatibility: | Windows Mac-Intel |
| Release Notes: |
This is the first public release. |

Forum

Support

Gallery
Igor Pro 10
Learn More
Igor XOP Toolkit
Learn More
Igor NIDAQ Tools MX
Learn More