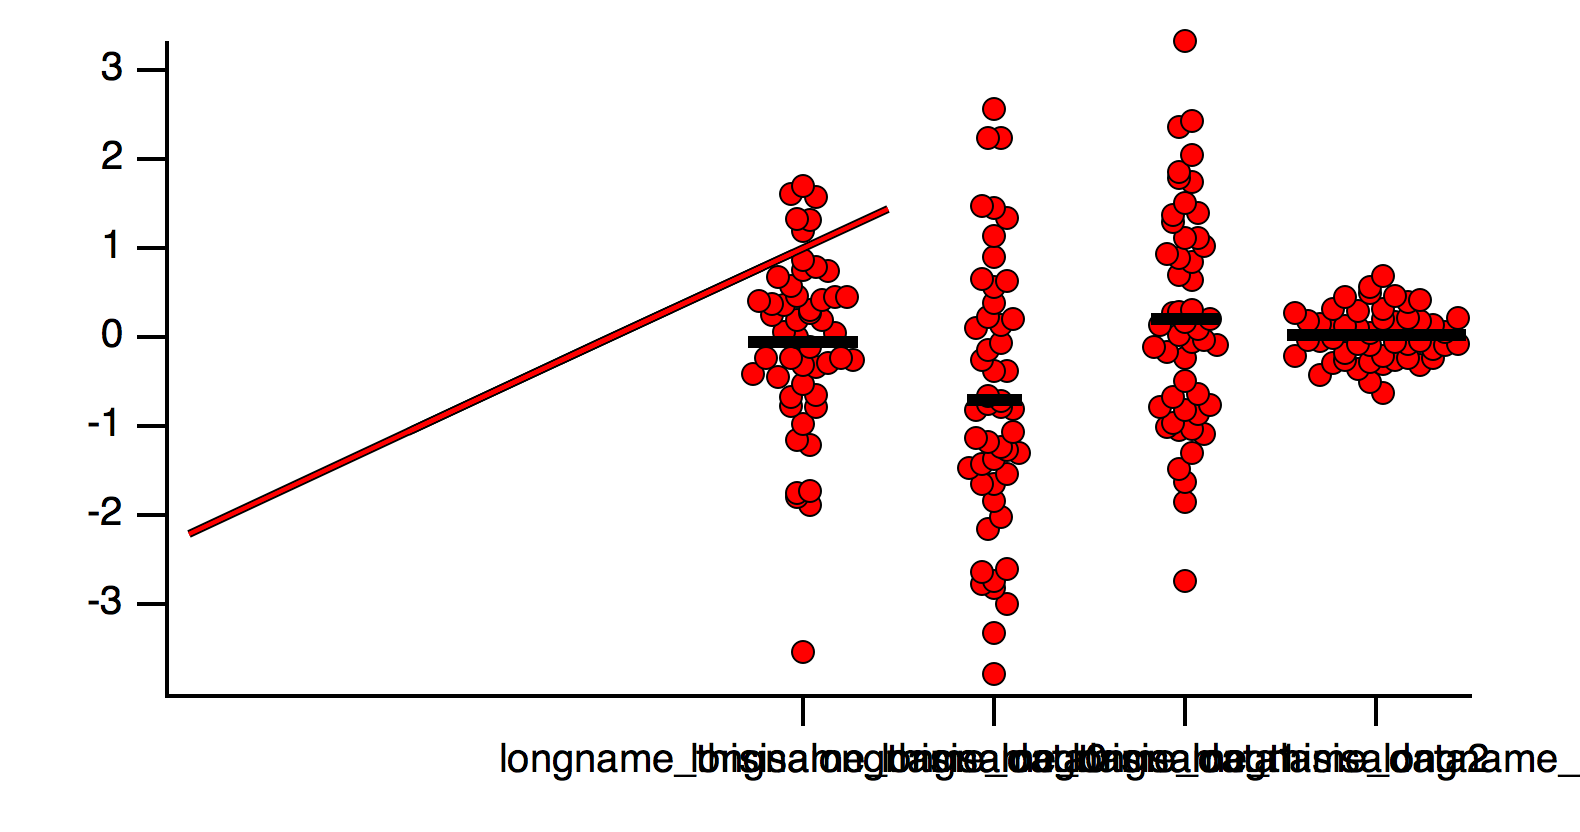
Scatter dot plot bug - error bars


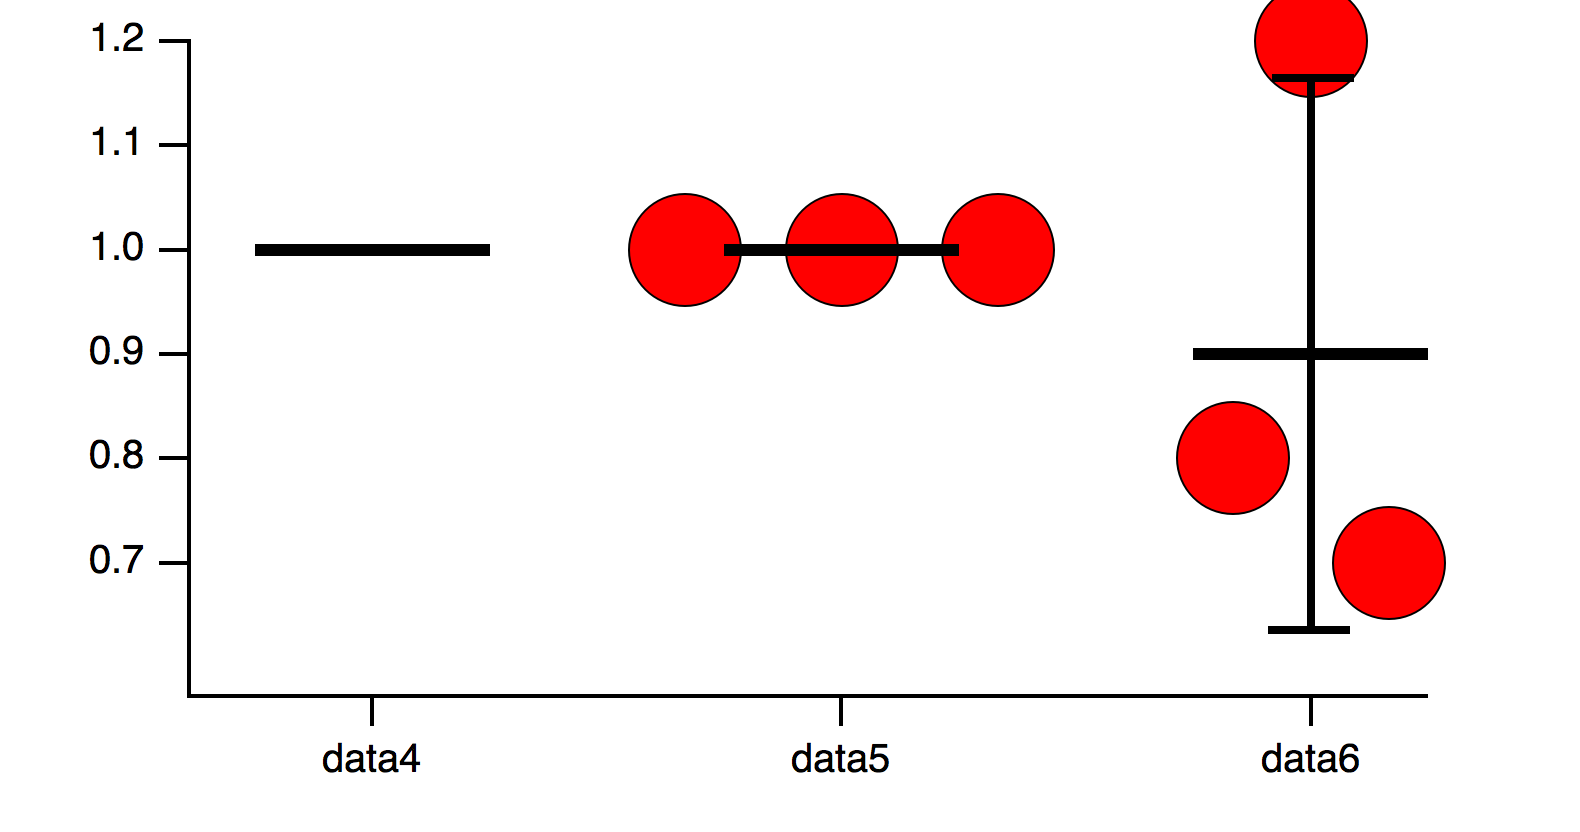
While I am at it, a wave with identical values is not handled well by scatter dot plot. For example, a wave of 1,1,1 doesn't get plotted properly, whereas 1,0.9999,1.0001 does (see 2nd picture).
•make/o/n=3 data4={1,1,1}
•make/o/n=3 data5={1,0.9999,1.0001}
•make/o/n=3 data6={0.8,0.7,1.2}
This is not a silly example, as we sometimes plot waves like this when the data have been normalised against a control group.
Thanks for pointing these bugs out. I will look into them. This is actually the kind of thing I like to get via an email to Igor support, but no need now. Consider it reported.
Cheers,
Nate Hyde
WaveMetrics
support@wavemetrics.com
August 9, 2016 at 01:15 pm - Permalink
Apologies, this isn't really a forum topic. I will email next time.
Steve
August 9, 2016 at 01:57 pm - Permalink
For the long wave names and for the case where all you have is waves with the same dang value (e.g. data4={1,1,1}, data5={1,1,1}, etc) then you will need to get the latest version of Scatter Dot Plot.ipf. That will come out with the next Igor release. If you'd like it before email me at support and I'll send it to you with instructions on where to put it.
Cheers,
Nate
August 9, 2016 at 05:48 pm - Permalink