tSort

tSort
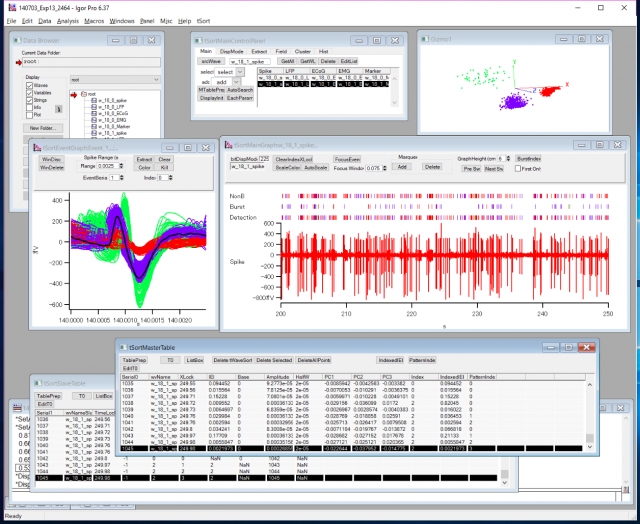
An Igor Pro GUI which offers a spike sorting environment for extracellular recordings with microelectrodes.
Getting Started
Prerequisites
- tUtility (https://github.com/yuichi-takeuchi/tUtility)
- SetWindowExt.XOP (https://github.com/yuichi-takeuchi/SetWindowExt)
This code has been tested in Igor Pro version 6.3.7.2. for Windows and supposed to work in Igor Pro 6.1 or later.
Installing
- Install Igor Pro 6.1 or later.
- Put GlobalProcedure.ipf of tUtility or its shortcut into the Igor Procedures folder, which is normally located at My Documents\WaveMetrics\Igor Pro 6 User Files\Igor Procedures.
- SetWindowExt.xop or its shortcut into the Igor Extensions folder, which is normally located at My Documents\WaveMetrics\Igor Pro 6 User Files\Igor Extensions.
- Optional: SetWindowExt Help.ipf or its shortcut into the Igor Help Files folder, which is normally located at My Documents\WaveMetrics\Igor Pro 6 User Files\Igor Help Files.
- Put tSort.ipf or its shortcut into the Igor Procedure folder.
- Restart Igor Pro.
How to initialize the tSort GUI
- Click "tSortInitialize" in "Initialize" submenu of "tSort" menu.
- Main control panel (tSortMainControlPanel), main graph (tSortMainGraph), event graph (tSortEventGraph), master table (tSortMasterTable), and slave table (tSortSlabeTable) windows will appear.
How to use
Spike detection and sorting
- Get your waves into the List on "Main" tab of the main control panel using "GetAll" or "GetWL" buttons. The names of source waves on the list can directly be edited by cliking "EditList" button. Spike, LFP, ECoG, EMG, and Marker fields supporse to have high-pass filterd waves, low-pass filterd waves, LFP of another brain region, EMG, and TTL signal for stimulation. The list must have at least waves in the Spike field.
- Set parameters for spike detection in "Extract" tab of the main control panel.
- Set a source wave for analysis by clicking "srcWave" button on the Main tab of the main control panel.
- Make the master table and the main graph ready for spike detection by clicking "MTablePrep" and then "DisplayInit" buttons on the Main tab.
- Detect spikes on the source wave by clicking "AutoSearch" button on the Main tab.
- Calculate several parameters associated with spikes (interevent intervals etc.) by clicking "EachParam" button on the Main tab.
- Move on the next sweep (wave) by clicking "Next Sw" button on the panel of the main graph.
- Repeat 5 to 7 over your all waves on the list.
- Extract waveforms of all events by clicking "Extract" button of the event graph.
- Do principle component analysis and get the first three figures for each spike by clicking "PCA" button on the Cluster tab of the main control panel.
- Do clustering by clicking "FPC" button in Minimum group on the Cluster tab.
- Calculate indexed interevent intervals and pattern index by clicking "IndexedIEI" and "PatternIndex" buttons on the master table.
- Sort each unit whether burst or non-burst by clicking "BurstIndex" button on the panel of the main graph.
Analsysis of spontaneous firing
0. Set the analysis mode as Spontaneous by "Analysis Mode" pull-down menu on the Hist tab of the main control panel.
1. Make the slave table ready for the analysis by clicking "STablePrep" button on the Hist tab.
2. Specify source wave for analysis.
3. Display the source wave and then detect spikes on it by clicking "DisplayInit" and "AutoSearch" buttons on the Hist tab.
4. Repeat 2 to 3.
5. Sort each unit whether burst or non-burst by clicking "BurstIndex" button on the slave table.
6. Make raster waves by clicking "Raster" button on the Hist tab of the main control panel.
7. Make a summary of firing rate of each unit by clicking "Sponta Hz" button on the Hist tab.
8. Have firing rate histogram by cliking "Histogram" button on the Hist tab.
Anasysis of evoked firing (peri-stimulus time histogram)
0. Set the analyisis mode as PSTH by "Analysis Mode" pull-down menu on the Hist tab of the main control panel.
1. Make the slave table ready for the analysis by clicking "STablePrep" button on the Hist tab.
2. Set detection analytical parameters on the Hist tab (number of trials, time window width etc.).
3. Specify source wave for analysis.
4. Display the source wave and then detect spikes on it by clicking "DisplayInit" and "AutoSearch" buttons on the Hist tab.
5. Repeat 3 to 4.
6. Sort each unit whether burst or non-burst by clicking "BurstIndex" button on the slave table.
7. Make raster waves by clicking "Raster" button on the Hist tab of the main control panel.
8. Have firing rate histogram by cliking "Histogram" button on the Hist tab.
Making output reports
* Main Graph: Select components to display by check boxes and have a prefered view by clicking "Transform" button on the DispMode tab of the main control panel. After that have a new graph by clicking "tWaveSortGraph" button on the Hist tab of the main control panel.
* Traces of single trial: Specify a specific trial number on the Hist tab and then click "EachTrialGraph" button.
* Traces of all trials: Click "AllTrialGraph" button on the Hist tab.
* Waveform graph: Click "PlainEvents" button on the Hist tab.
* 3D feature plot: Click "NewPCGizmo" and "ExportGizmo" buttons for creation and exportion.
Help
* Click "Help" in "tSort" menu.
Versioning
We use SemVer (http://semver.org/) for versioning.
Releases
* Version 1.0.0, 2017/06/10
* Prerelease, 2017/06/06
Authors
* Yuichi Takeuchi PhD
License
This project is licensed under the MIT License.
Acknowledgments
* Department of Physiology, Tokyo Women's Medical University, Tokyo, Japan
* John Economides (http://www.igorexchange.com/project/GenSpikeSorting)
References
tSort has been used for the following works:
- Takeuchi Y, Osaki H, Yagasaki Y, Katayama Y, Miyata M (2017) Afferent Fiber Remodeling in the Somatosensory Thalamus of Mice as a Neural Basis of Somatotopic Reorganization in the Brain and Ectopic Mechanical Hypersensitivity after Peripheral Sensory Nerve Injury. eNeuro 4: e0345-0316.
- Nagumo Y, Ueta Y, Nakayama H, Osaki H, Takeuchi Y, Uesaka N, Kano M, Miyata M (2020) Tonic GABAergic inhibition is essential for nerve injury-induced afferent remodeling in the somatosensory thalamus and associated ectopic sensations. Cell Rep 31: 107797.
Images:
Project Details
| Project Homepage: | View Homepage |
| Project License: | MIT |
Current Project Release
tSort IGOR.6.30.x-1.0
| Release File: | tSort-1.0.0.zip (1.77 MB) |
| Version: | IGOR.6.30.x-1.0 |
| Version Date: | |
| Version Major: | 1 |
| Version Patch Level: | 0 |
| OS Compatibility: | Windows |
| Release Notes: |
The first release on 2017/06/10. |

Forum

Support

Gallery
Igor Pro 10
Learn More
Igor XOP Toolkit
Learn More
Igor NIDAQ Tools MX
Learn More
Hi!,
I couldn't access to the SetWindowExt.XOP from http://fermi.uchicago.edu/freeware/LoomisWood/SetWindowExt.shtml
There is another way to obtain it?
Thanks,
Pedro.
October 3, 2019 at 01:27 am - Permalink
Please find it here. Sorry for late.
June 11, 2020 at 10:13 am - Permalink