Box Plot outliers at Percentile Level rather than 1.5 x IQR


With ModifyBoxPlot, one can adjust the length of the whiskers in a boxplot quite easily, including: Min and Max Data, Inner Fences, One standard deviation, 9th and 91st percentiles, 2nd and 98th percentiles...
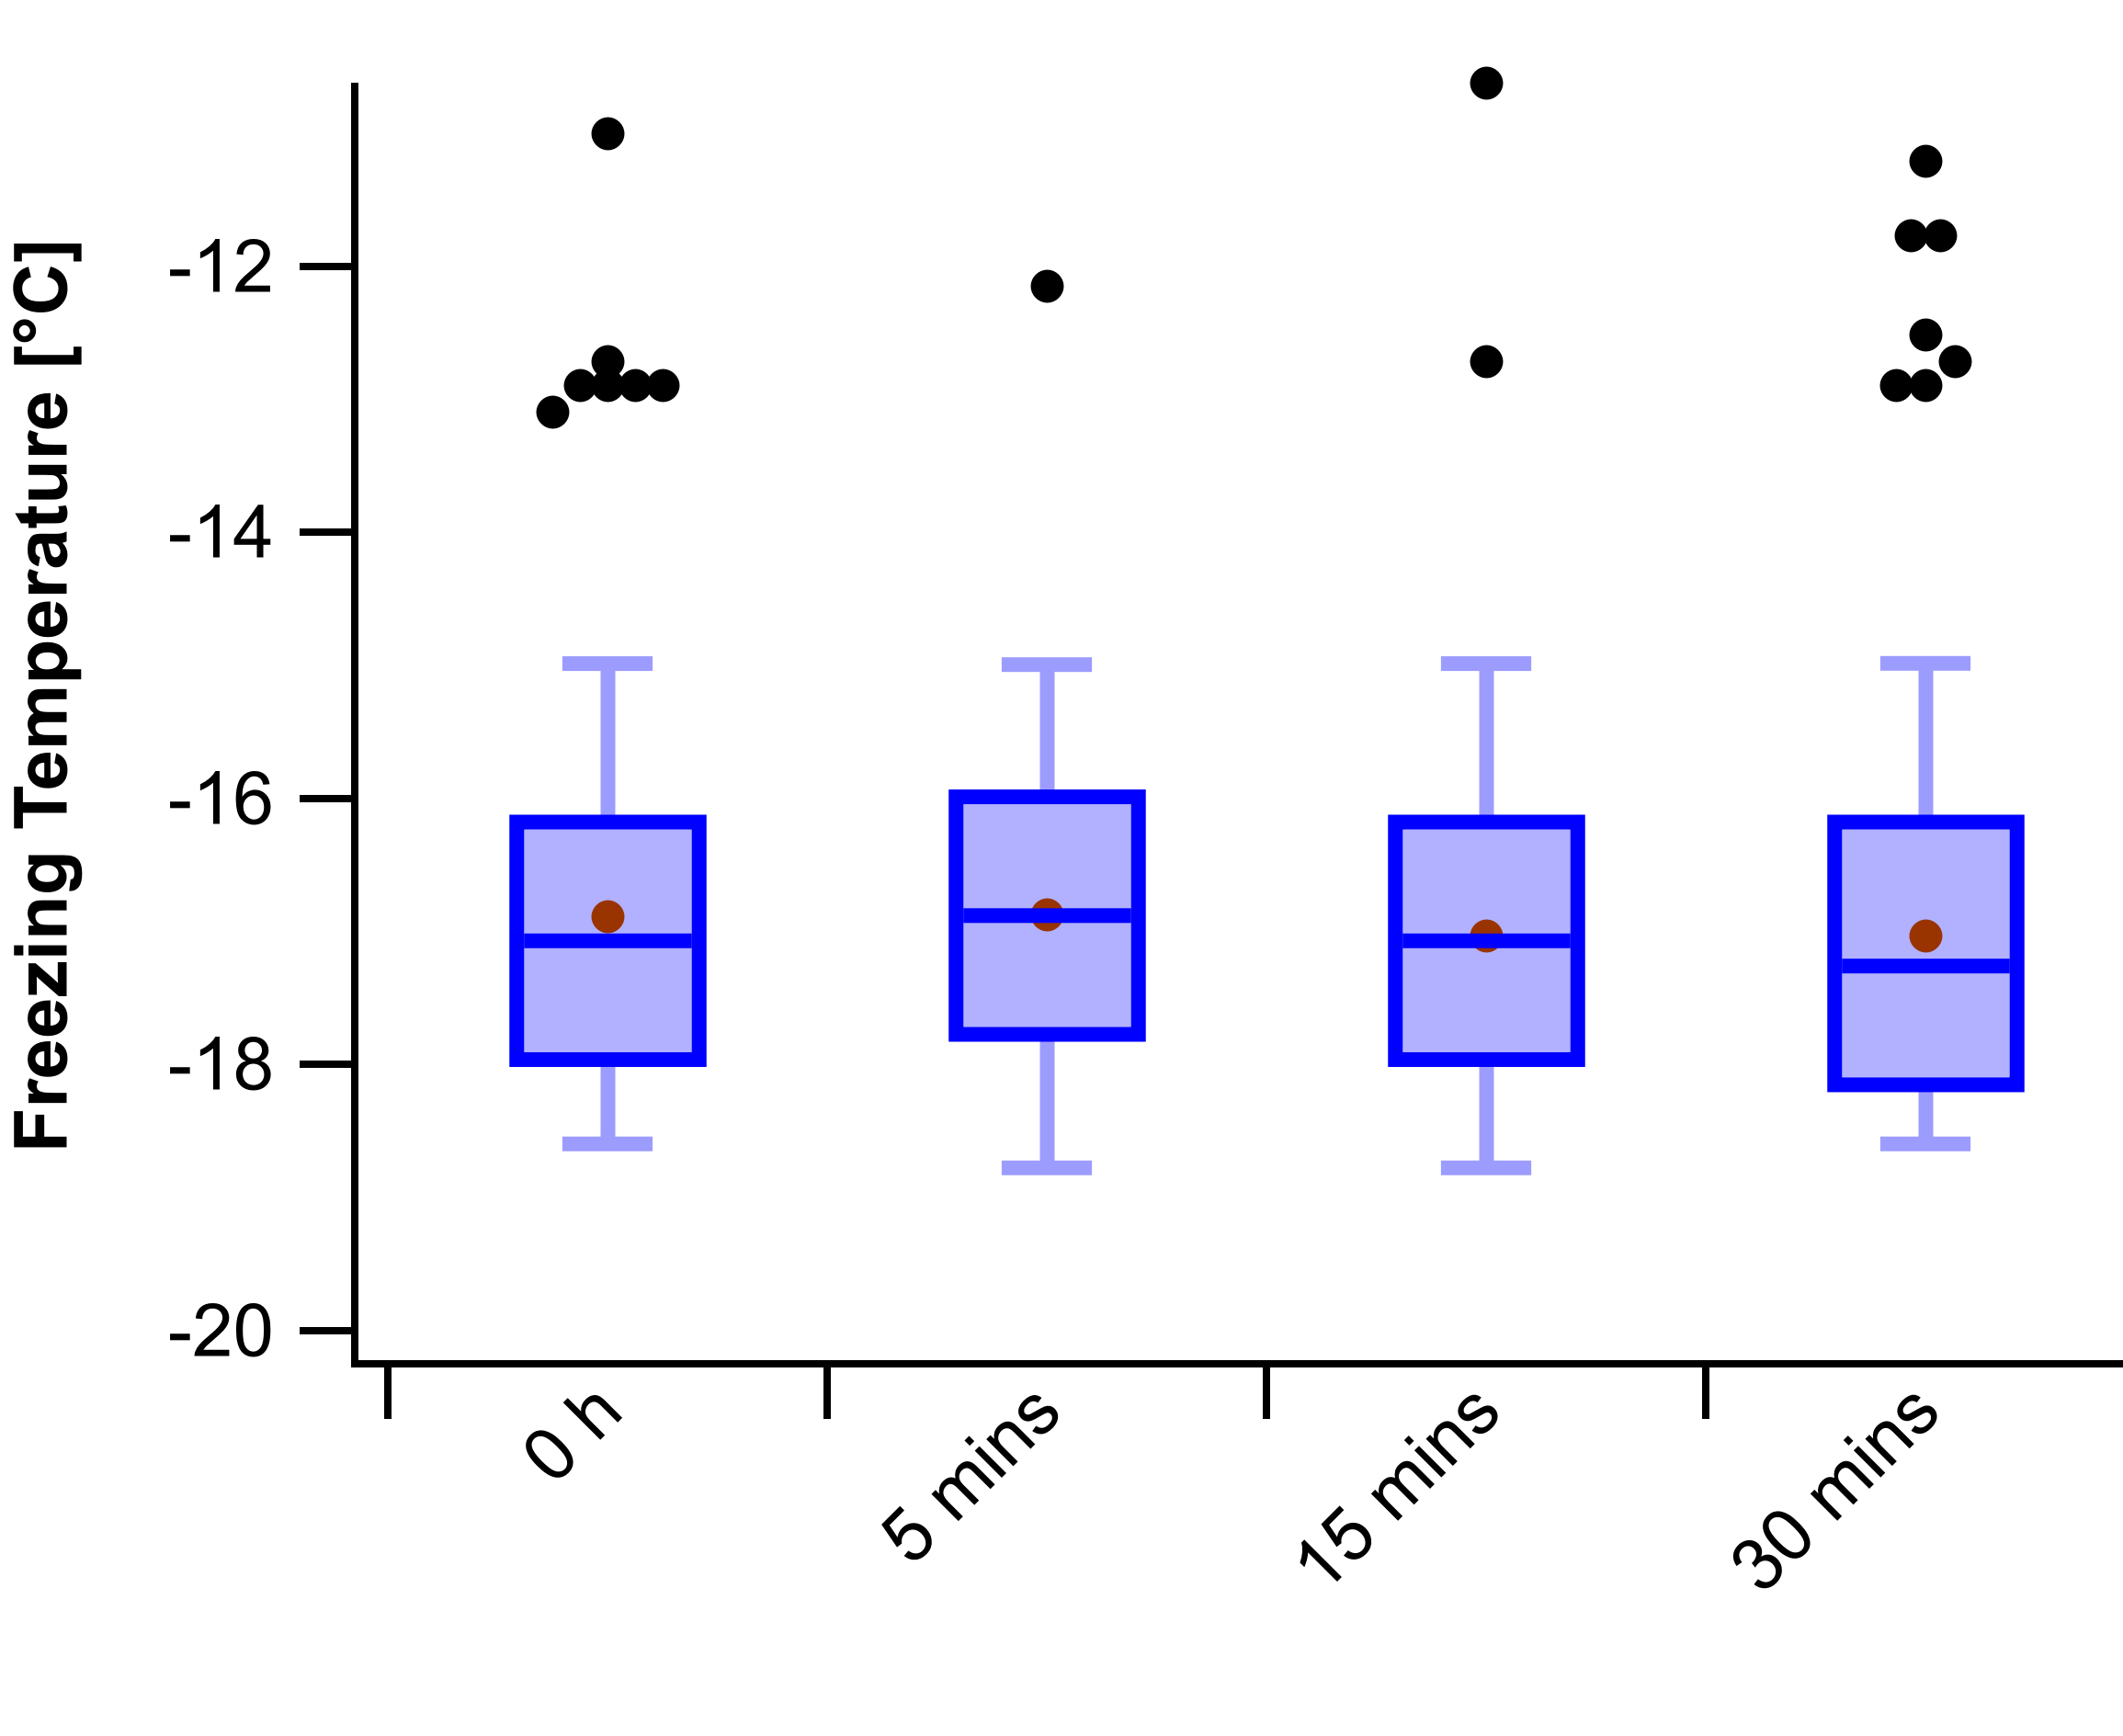
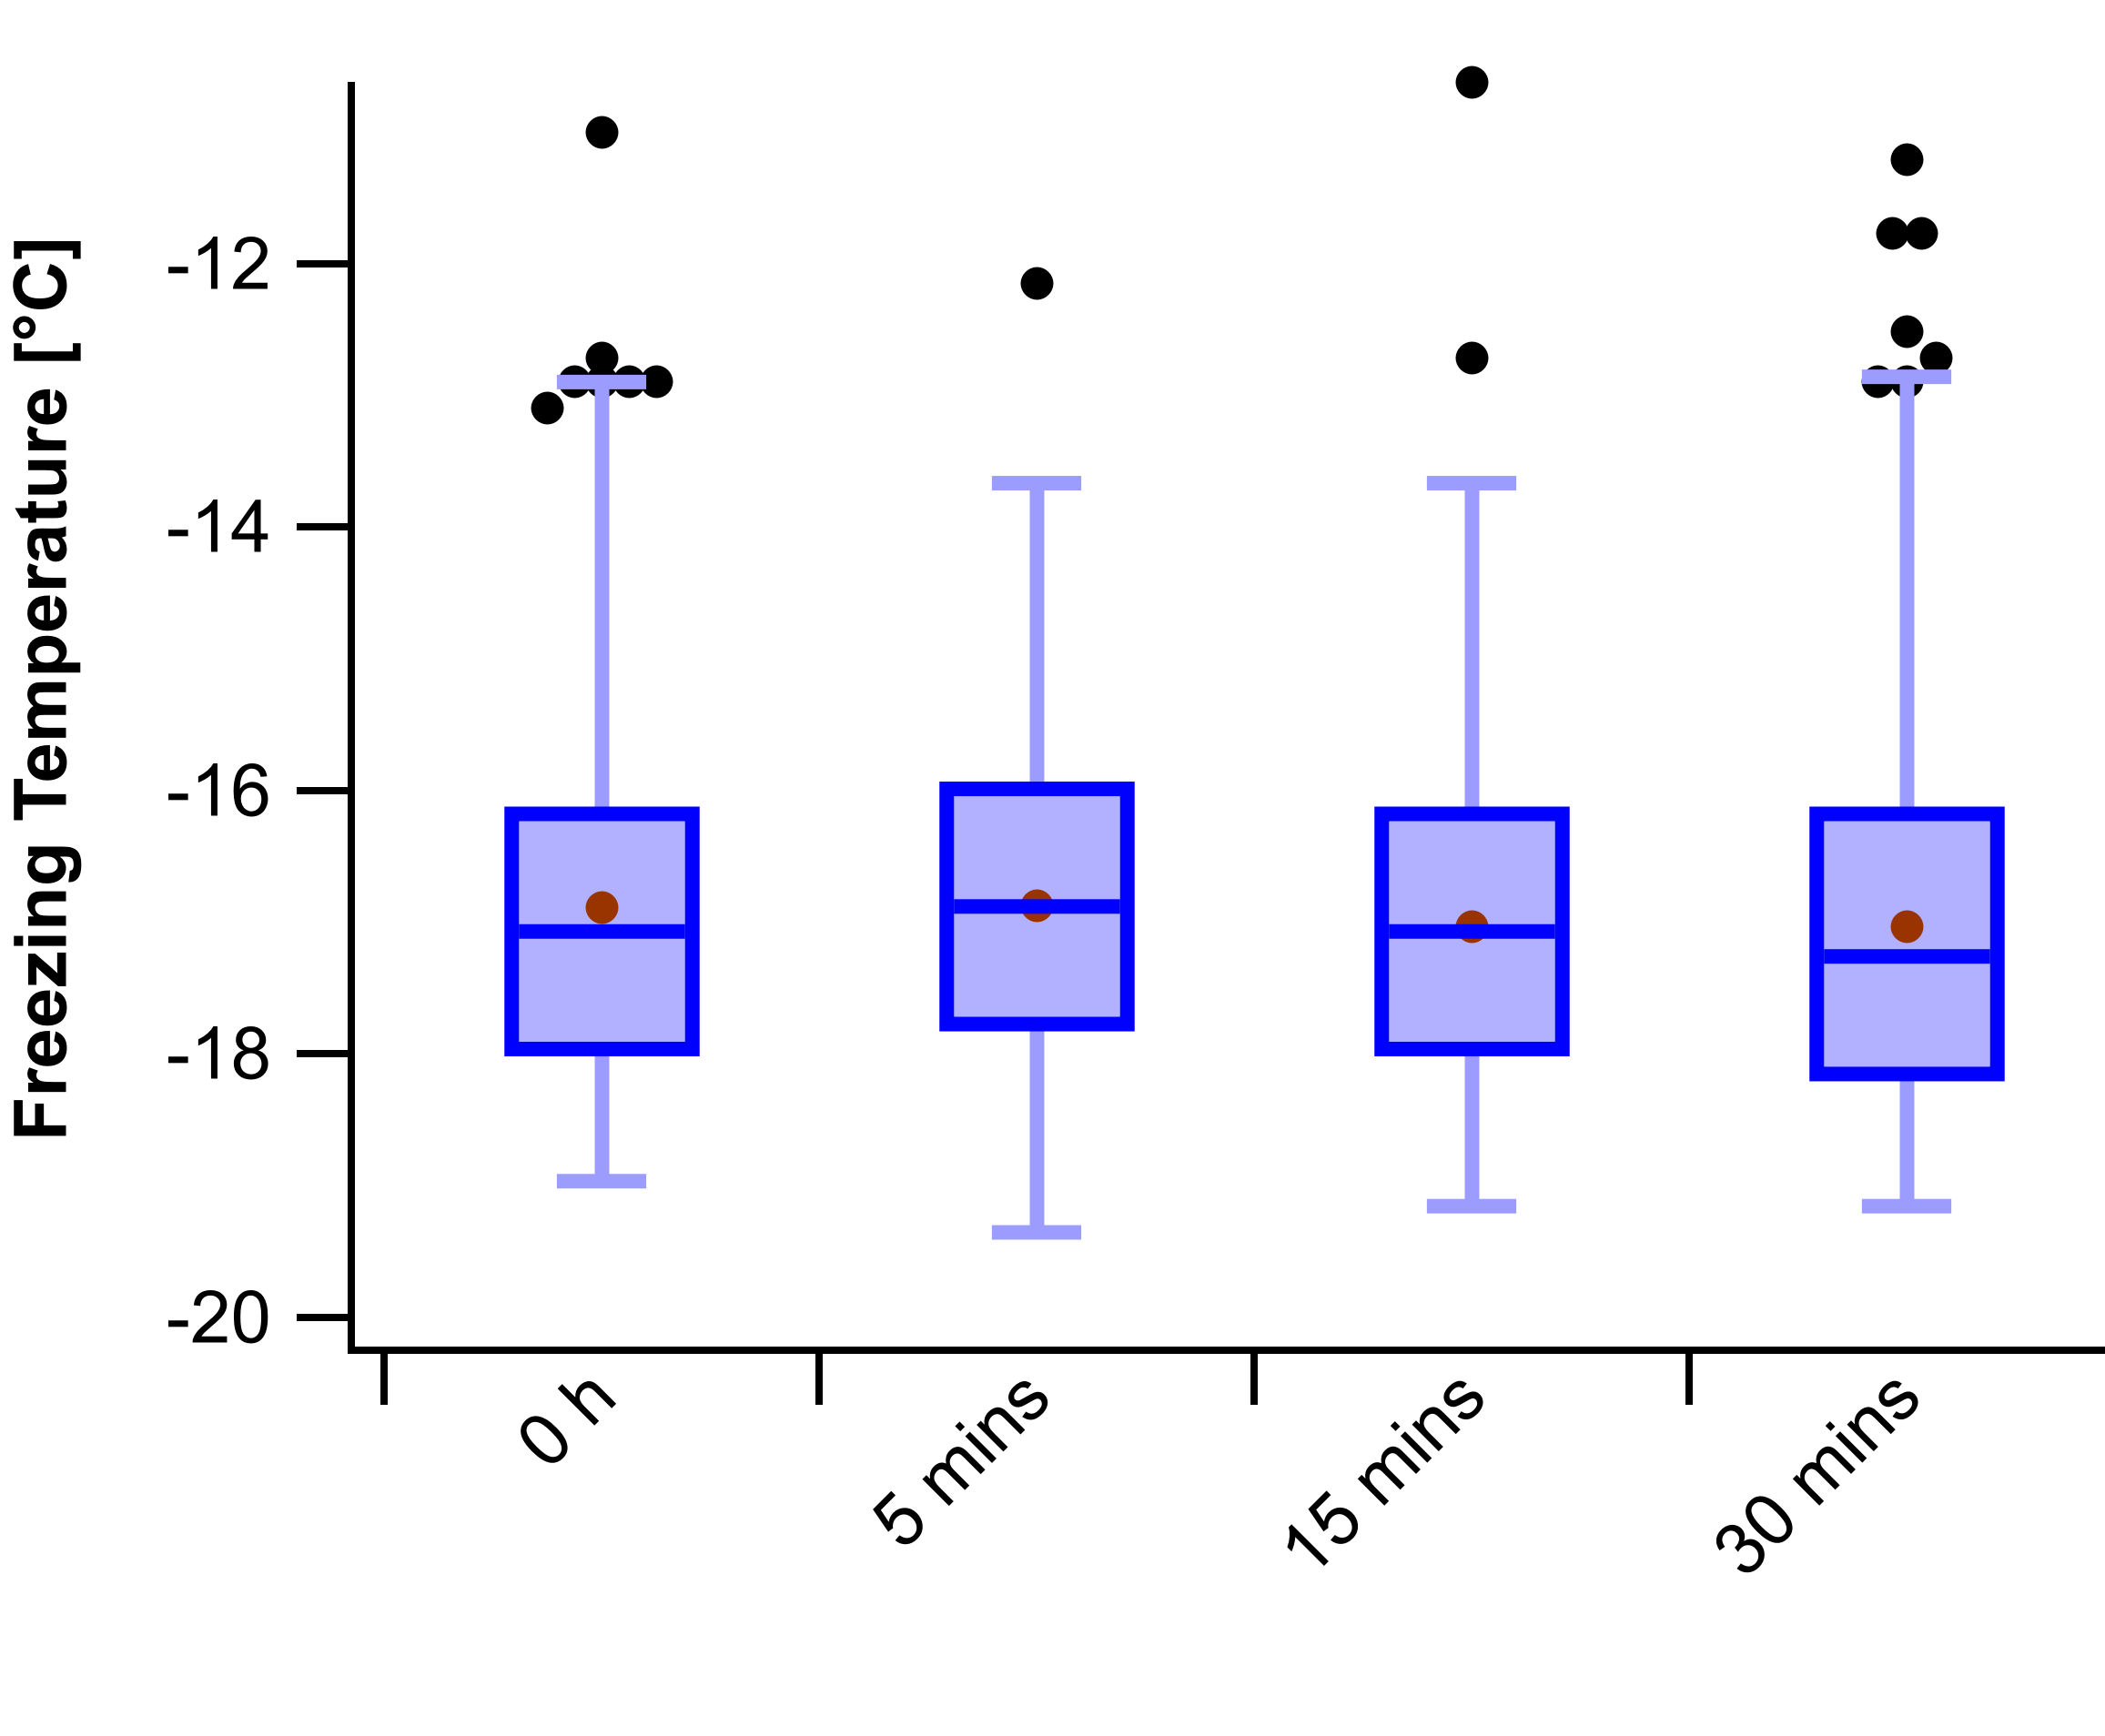
However, there does not seem to be an option to change the cutoff value for outliers accordingly. If 2nd and 98th percentiles are chosen as the whisker method, the whiskers overlap the outliers, and with 9th and 91st percentiles, there is a large gap between outliers and whiskers (see attached figures). Outliers being > or < 1.5*IQR seem to be hard-coded.
Seeing that the length of the whiskers can be modified to reflect percentiles, it would be great to also have that same option for the outliers.
Thanks,
Silvan
So what you want is an option to say that outliers are "anything beyond the ends of the whiskers"? That leaves the question of what far outliers should be.
I am quite happy to entertain enhancements to Igor's box plots. When I implemented them, I read Tukey and Googled images of box plots. The result is what you see- in particular, the definition of "outliers" and "far outliers" is straight out of Tukey.
Do you have a favorite source for descriptions of how box plots should be laid out?
December 10, 2019 at 10:46 am - Permalink
Yes, exactly! Specifically, we would like our boxplots to indicate values such as 5th & 95th or 10th & 90th percentiles. We would have whiskers extending to those percentiles, and points outside that range would be considered outliers, with no particular distinction between outliers and far outliers. I've attached an example of what this would look like in a scientific publication in our field (ice nucleation processes in the atmosphere).
To my knowledge, the idea of using percentiles in place of 1.5*IQR for the whiskers has been introduced by Cleveland in 1985, in "The elements of graphing data".
An implementation of his approach is also described in this document, section 3.5: https://journals.sagepub.com/doi/abs/10.1177/1536867X0900900309
December 11, 2019 at 07:15 am - Permalink
I just ordered two Cleveland books. Your desire for arbitrary whisker ends specified as percentiles seems reasonable, and outliers that are simply everything beyond the whisker ends also seems reasonable. It might be possible to get it into 9; it's getting to the end of our development cycle.
December 11, 2019 at 10:43 am - Permalink
That's great, thank you! I highly appreciate it. Do you have any suggestion for how we could work around this in the meantime?
December 12, 2019 at 06:28 am - Permalink
I hesitate to suggest it, but you can probably do what you want with the old Box Plot package, Windows->New->Packages->Box Plot. That package has it's own problems, but it may offer sufficient flexibility to achieve your plot.
December 12, 2019 at 09:22 am - Permalink
Well, I have implemented some new box plot stuff for Igor 9. The ModifyBoxPlot operation will now accept two new options for whiskerMethod:
Method 6 allows you to set the whisker ends at any arbitrary percentile. Method 7 allows you to request whisker ends at a given factor times the standard deviation.
I have also added a new keyword, outlierMethod:
Method 1 is simply Tukey's original method, which is the only option in Igor 8.
Method 2 is what you were asking for: outliers are anything beyond the ends of the whiskers.
Method 3 sets outliers and far outliers as anything outside of mean += outlierSD*SD and mean +- farOutlierSD*SD
Method 4 sets outliers to be at any arbitrary cutoff in your data.
December 19, 2019 at 03:02 pm - Permalink
That sounds fantastic! Thank you. I look forward to having these new options, is there any way for us to use it before IGOR 9's release?
December 28, 2019 at 02:15 am - Permalink
We will be starting beta testing "soon". Presumably we will post something on Igor Forums or by email with an invitation to test.
January 2, 2020 at 01:47 pm - Permalink