Modify Graph Dialog - Possibility to set (or at least see) the total graph size


In the Modify Graph dialog it is possible to set the size of the graph. The problem is that there is no easy way to set the total graph size, i.e., the size of the graph area + margins. Lately, I tend to prepare figures for presentations and publications only within Igor (in the past I often took another brush-up step in an external graphics software). Of course, in both cases one ultimately wants a graph of this and this size in total. Currently, I use the Absolute mode and set the graph area and margins to add up to the correct size (hopefully, if I got all numbers right). Then, if I realize I want to change the margins a bit after all, I have to to the math again and change the graph area as well. If I would want to use the PerUnit mode such calculation is starting to get a real headache.
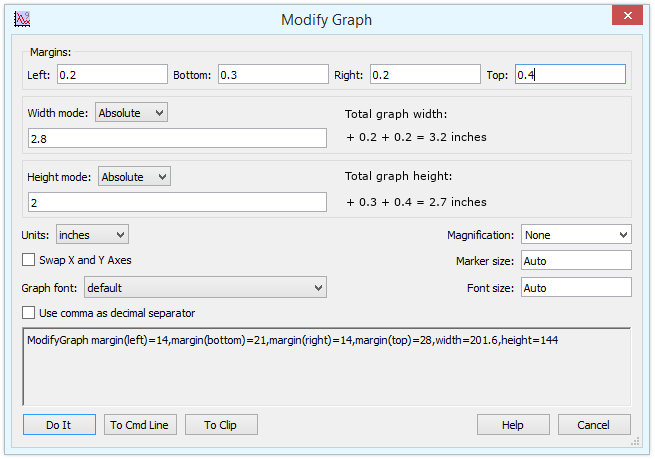
It would be really great if there was an option to set the total graph size as well, with which graph area and margins are automatically adjusted. Or, alternatively at least show the resulting total graph width and height in the selected unit (or even multiple units for convenience!) somewhere for confirmation, like in the attached mock-up.
Hmm, there is no response so far. So I guess this one is not happening too soon. I wrote a panel instead which recreates the main functionality of the Modify Graph panel with the option to see and set the total graph size. Work's only for the Auto and Absolute modes, though. If anyone is interested, see here:
https://www.wavemetrics.com/code-snippet/small-panel-set-graphs-size-margins-magnifcation-and-font-size
July 9, 2020 at 07:08 pm - Permalink
Heh. Dialogs are tough.
Your example there has all margins set; if any margin is 0 (auto) then it is really tough to display the total window size. I think the fact that you have implemented Auto and Absolute modes indicates some of the difficulties...
In fact, how did you implement the Auto mode? Actually, I guess that's easy- it's just the window size. So this is mostly useful for Absolute mode. But since we actually recommend using Absolute mode with the margins set, exactly for your use case, perhaps we need to think about this.
I think in the past the recommended solution was to put the graph into a layout, and layouts have some facilities for making graphs in uniform sizes and lining them up, etc. But your use case is for a journal-specified size that you need to apply to a single graph, so going to a layout adds an extra step.
I will think about this....
July 10, 2020 at 09:40 am - Permalink
If you need to export a graph with a fixed size, you can use the File->Save Graphics dialog (or the SavePICT command) to export a graph of a specific size.
We could add some text in the dialog that does the math for you when you're using absolute mode and have fixed margins, but outside of that one situation I don't think it would be relevant. Would the addition of such information, but only in one specific situation, be more helpful than it would be confusing?
It might help us understand your motivations if you can give a more complete example of your use case/workflow.
July 10, 2020 at 11:48 am - Permalink
Thank you for having it on your list. First, here are my use cases:
Yes, I know you can work with layouts, which however is an extra step and not as straight-forward as it could be (you have to first get the layout size right, then delete the frames around graphs etc.). Why wrap the graph in another layer? Also, I know you can export graphs with a fixed target size, but this is not WYSIWYG at all, since ticks, fonts, annotation positions etc. will change accordingly. Then, I usually don't export graphs anymore but instead just copy-paste them directly between applications.
Regardless of these use cases, I think what is missing now is an always ready indication of the current total graph size (i.e., what you get from GetWindow gsize, but without the fractional 'offsets'?). I imagine an info window somewhere or even a small tool-tip popping up when moving the cursor to the edges of the graph with the total x/y size indicated in all three units. This would be especially useful for other modes like perUnit for example (here I really need to get out the calculator). It would be OK to have the number stated always inside the Modify Graph dialog, but having it visible even when 'free-scaling' a graph would be much more convenient. Maybe showing these number in the info bar on the fly here?
Currently, I see three problems:
My panel from the code snippet solves all these issues for me. I but I would be happy if there is an official solution.
July 10, 2020 at 04:41 pm - Permalink
Is the issue here the same as the variations that seem to happen in margin offsets depending on the number of significant digits in a label value? For example, all else exactly the same, the "bounding box frame" for a graph with an ordinate that goes from 0 to 1 will be slightly wider than the same frame for an ordinate that goes from 0 to 100?
> There is no copy function and you do not get the commands unless you change something.
I think you hit the key here. Make one graph to the definitions. What you want is a copy + paste command for the graph scales.
But isn't this what the style macro is supposed to handle? Or does the style macro not handle this?
I *think* that I see the problem. I believe that I also have this concern, and I would also like to know whether I really understand the best way to fix it.
July 10, 2020 at 05:48 pm - Permalink
Jeffrey, thanks for the reply. The variation of the margin depending on the number of digits is another small 'issue' on top of above points. This is exactly the scenario where you want to control both the plot area (to make the axes of two graphs equally long) and the total graph size (with different margins to keep the overall format). By the way, in Auto mode the margins change dynamically depending on the size of the font (which usually changes dynamically with the graph size), whether there are ticks/labels and, as you already wrote, with the number of displayed digits.
And no, unfortunately style macros are not a good solution here. You could create a style macro and then copy just the commands for the graph size and the margins etc. I doubt the average user knows the correct ones or even find the code for style macros in the procedure window. Maybe the introduction of an additional 'Size Macro' would help, where just the settings of the Modify Graph dialog are transferred to the graph macro. Yes, I also realize that the average user might not care too much about correct graph sizes or instead take the extra step via a graphics software rather than doing things in Igor. But this is something I think should be changed.
Imagine my happiness when, for example, I have to change the underlying data somehow and the graph updates with everything already in place in a perfectly publication ready graph! Just copy-paste or export again - done! I while I do the effort to make that happen, I often just get an experiment file with the bare skeleton of a graph from my colleagues, with the note that 'the rest is done in power point/illustrator/inkscape/photoshop' - argh.
Did you have a look at my code snippet? I think having something like this (and extended to the perUnit, Plan, Aspect modes) in the Modify Graph dialog would solve these points. Of course, compared to the snippet the complexity should be toned down, and proper labels on everything wound not hurt either. ;)
July 10, 2020 at 09:43 pm - Permalink
I think anything along these lines would have to apply only to fixed margins. As noted, with Auto margins, the margins dynamically respond to a number of changes. We have always said that if you must have a fixed size, you need to set both Absolute mode and fix the margins. I agree that can be less than straightforward presently.
Extending this to all those obscure sizing modes might be problematic as well, since they are also dynamic. Only Absolute mode keeps the window size fixed. Well, as I think about it, I can see that other modes could come in- like using Aspect mode on the Height combined with Absolute mode in width. This starts to sound like a Difficult Problem in the complexity of interactions...
July 13, 2020 at 10:19 am - Permalink
John, thanks for your response. I think at least half of the problem is that there are no tangible numbers in Auto mode at all, and no indication of the total size any mode. So even if it would be difficult to implement setting the total size directly (that would probably require fixed margins as you write), we really need imho:
If these things are there I would be happy without the ability to set the total size directly (Ok, I have my own panel for this anyway now). ;)
July 13, 2020 at 12:03 pm - Permalink