Data Brushing


Hi,
This may be a huge ask, but if you don't ask then your dreams may not come true.
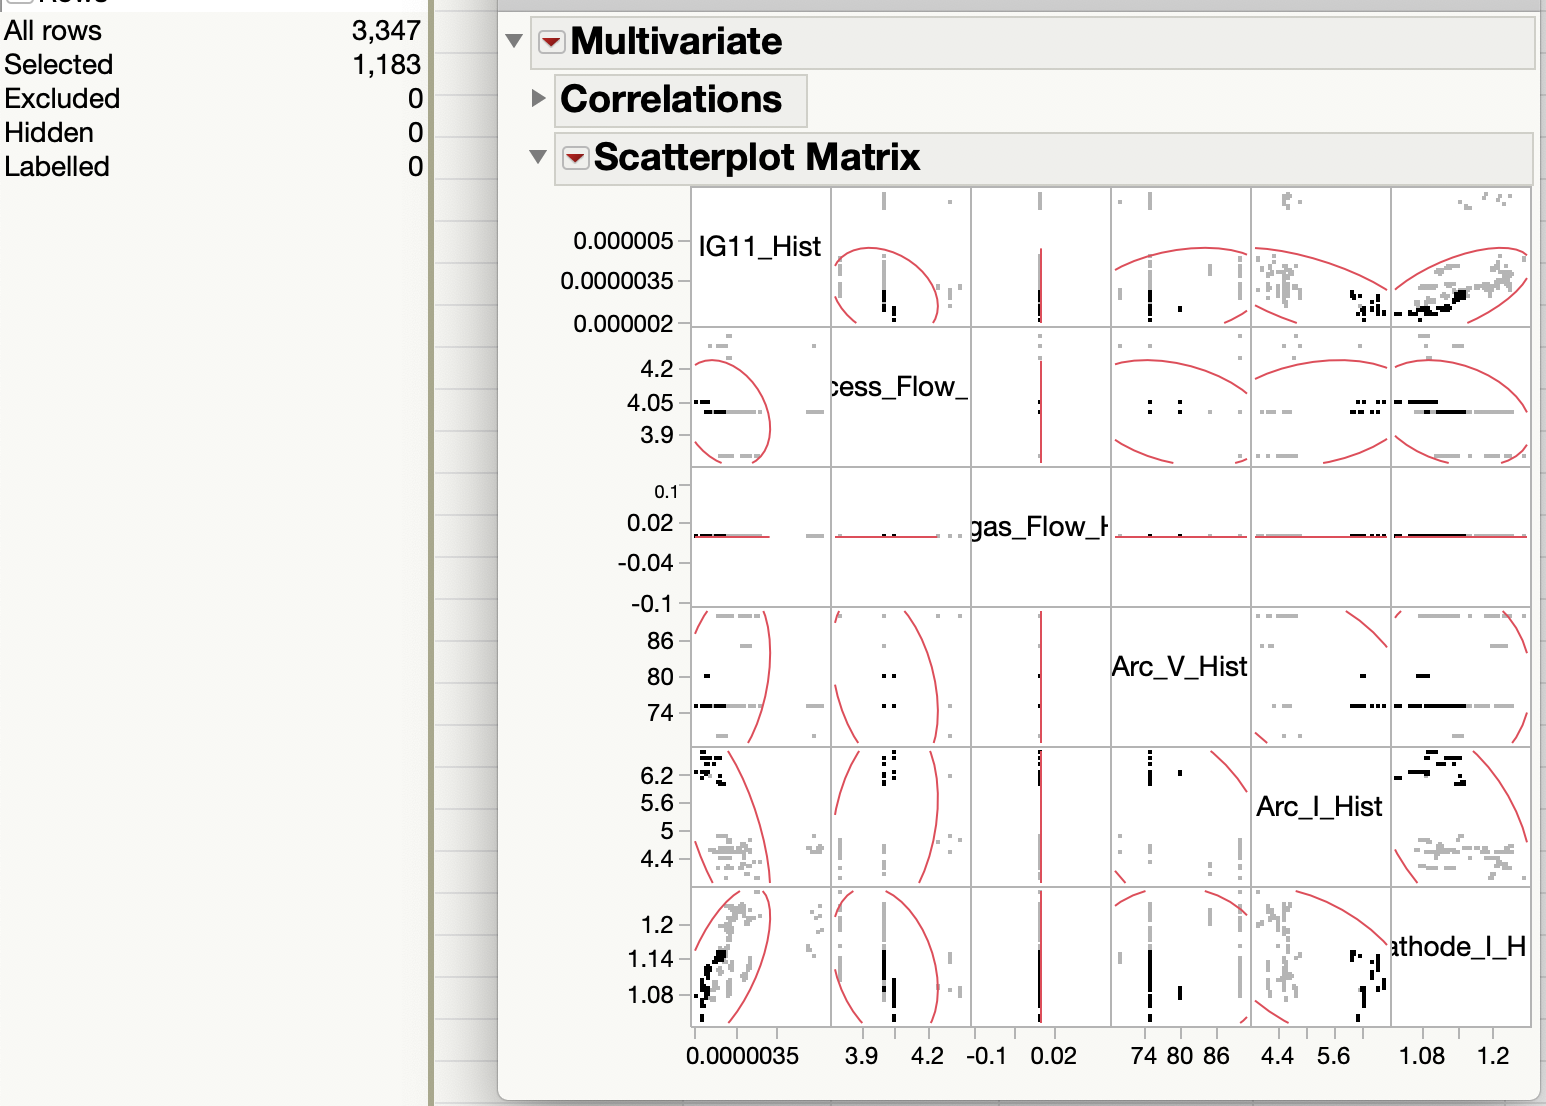
In some other tools I use there is the implementation of data brushing. Basically if data is highlighted in one graph or table it is selected in all other representations of the data. So if I highlight in one graph it shows up highlighted in all other graphs and in the underlying data table. I find this extremely useful when doing exploratory data analysis. I cobbled together one version of this using window hooks where I had mutely graphs on the same window. Worked but clunky. The example image shows a multivariate scatter plot with some of the points highlighted and they show as highlighted in the other subgraphs and the data table reflects their selection also.
Andy
It seems to me that you could get the graph part of this done using color as f(z) for all of the scatter plots.
I don't believe that the formatting of tables can be done on a per-row basis. You'd need to use a list box in a panel or graph to get something similar, I think.
It seems like this would be pretty complicated for us to build into Igor in such a way that is flexible enough to be useful to a wide audience.
If you have a more concrete example of something like this in Igor already and want ideas for how to implement it, let us know.
November 23, 2020 at 12:42 pm - Permalink
Hi,
Attached in the zip file is an example of data brushing across multiple graphs. (I can load mov file directly). I know this is a huge stretch. This was done in JMP from SAS Institute.
Andy
November 23, 2020 at 01:49 pm - Permalink
Since I have no idea how that data is organized, I don't have many suggestions.
You could use a window hook that calls GetMarquee to get the limits of the marquee in axis coordinates. Then you could run your code that changes the display of the graphs. That's the hard part. As I said before, if you're doing a scatter plot then you could use color as f(z) and you would just need to update the color wave. Doing bars like in the movie would be tricky. Perhaps you plot a mask wave on top of your regular data and control the values in the mask wave.
November 23, 2020 at 02:03 pm - Permalink
Our Scatterplot Matrix package has a primitive cabability. You can put a cursor on a data point in one of scatter plots, and it highlights that point in other members of the matrix.
November 23, 2020 at 05:15 pm - Permalink