Error bars rendering incorrectly in different file formats


I have a figure with error bars that I would like to save in a high-resolution format.
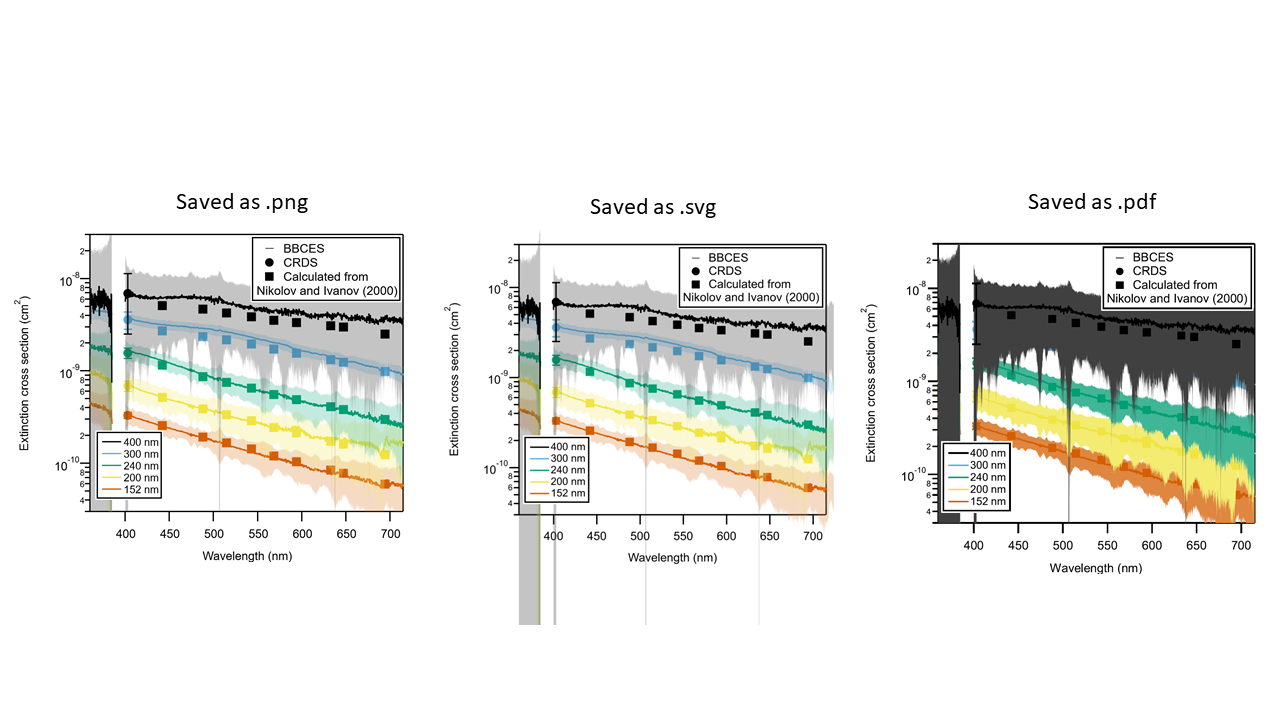
When I save it as a .png file, it looks fine.
When I save it as a .svg file, the error bars extend way beyond the graph edge.
When I save it as a .pdf file, the transparency of the error bars is wrong.
Anyone know if there are settings available to fix this? I'm preparing a figure for publication, and journals prefer .pdf format for figures.
When making these error bars, I have used the default setting (shading instead of bars, +Fill set to Solid, and the Foreground Color pop-up menu has "Opaque" unchecked, and Alpha set to 0).
On Windows using IP 8 or earlier, when exporting to PDF transparency is lost. You could change the color of your error shading to fully opaque (alpha=1). If you do that, the PDF export should look the same as the graph in Igor. But of course you won't be able to see the areas where the shading of different traces overlaps.
The issue with error bars and SVG export doesn't sound familiar so that might be a bug. If you can send your experiment and system information (Help->System Information) to support@wavemetrics.com we can take a look.
Igor Pro 9, currently in beta, has improved PDF export on Windows and supports transparency. You can sign up to be a beta tester at https://www.wavemetrics.com/form/igor-pro-9-beta-tester-signup.
March 26, 2021 at 08:08 am - Permalink
It is a bit difficult to help you without some crucial information: What is your Igor version (preferably build number) and operating system? Can you provide a minimally working example of the problem or share your experiment file? What was the exact export setting (command) you have used?
BTW, here on Windows 10, I get no transparency for the PDF export on Igor 8, but Igor 9 (beta) works nicely, but not when using CMYK colors (this limitation is actually written in the manual). It might be that transparency was not yet implemented in Igor 8's PDF export. The SVG export does not seem to clip error bars beyond the plot area, and that's the reason you see this behavior. This might be a bug or just the way it is (I don't know). You could fix that yourself relatively easily with an svg editor.
If you need a quick solution better write the support directly. If you can live without the blend effect then make the error shades opaque and choose a light color.
March 26, 2021 at 08:13 am - Permalink
Adam, I can confirm the overshooting shade area upon svg export. Here is a quick test file...
March 26, 2021 at 08:17 am - Permalink
I am running Igor 8.04, build 34722 on Windows 10 Pro x64.
The problem with the .pdf file is understandable now. I need the transparency though, so I'll have to wait for Igor 9 or use one of these other formats.
The problem with the .svg file not clipping the error bars is shown in the following experiment, with a simplified version of the plot.
The command is as follows:
I'll also send this to Support.
Thanks
March 26, 2021 at 12:50 pm - Permalink
I received the bug report sent in by CWomak. The cause is a limitation of the Qt framework's implementation of SVG. They used the SVG Tiny version of SVG, intended as a lightweight version primarily for use on phones. Once again, everyone wants us to use only a phone for everything!
At any rate, one of the heavyweight features that isn't in SVG Tiny is clipping! We depend on graphics clipping to keep the error shading within bounds.
I have come up with a work-around for the particular problem of clipping for error bar shading. I will probably get that into the Igor 9 beta soon.
I recall seeing recently someone indicating they wanted to use SVG so that they could open the graphics in something like InkScape. I will note that SVG Tiny can be opened in Inkscape, but Inkscape output is very likely not compatible with SVG Tiny, and so the reverse direction is very unlikely to work.
March 26, 2021 at 05:16 pm - Permalink