Floating bar plot


Hi,
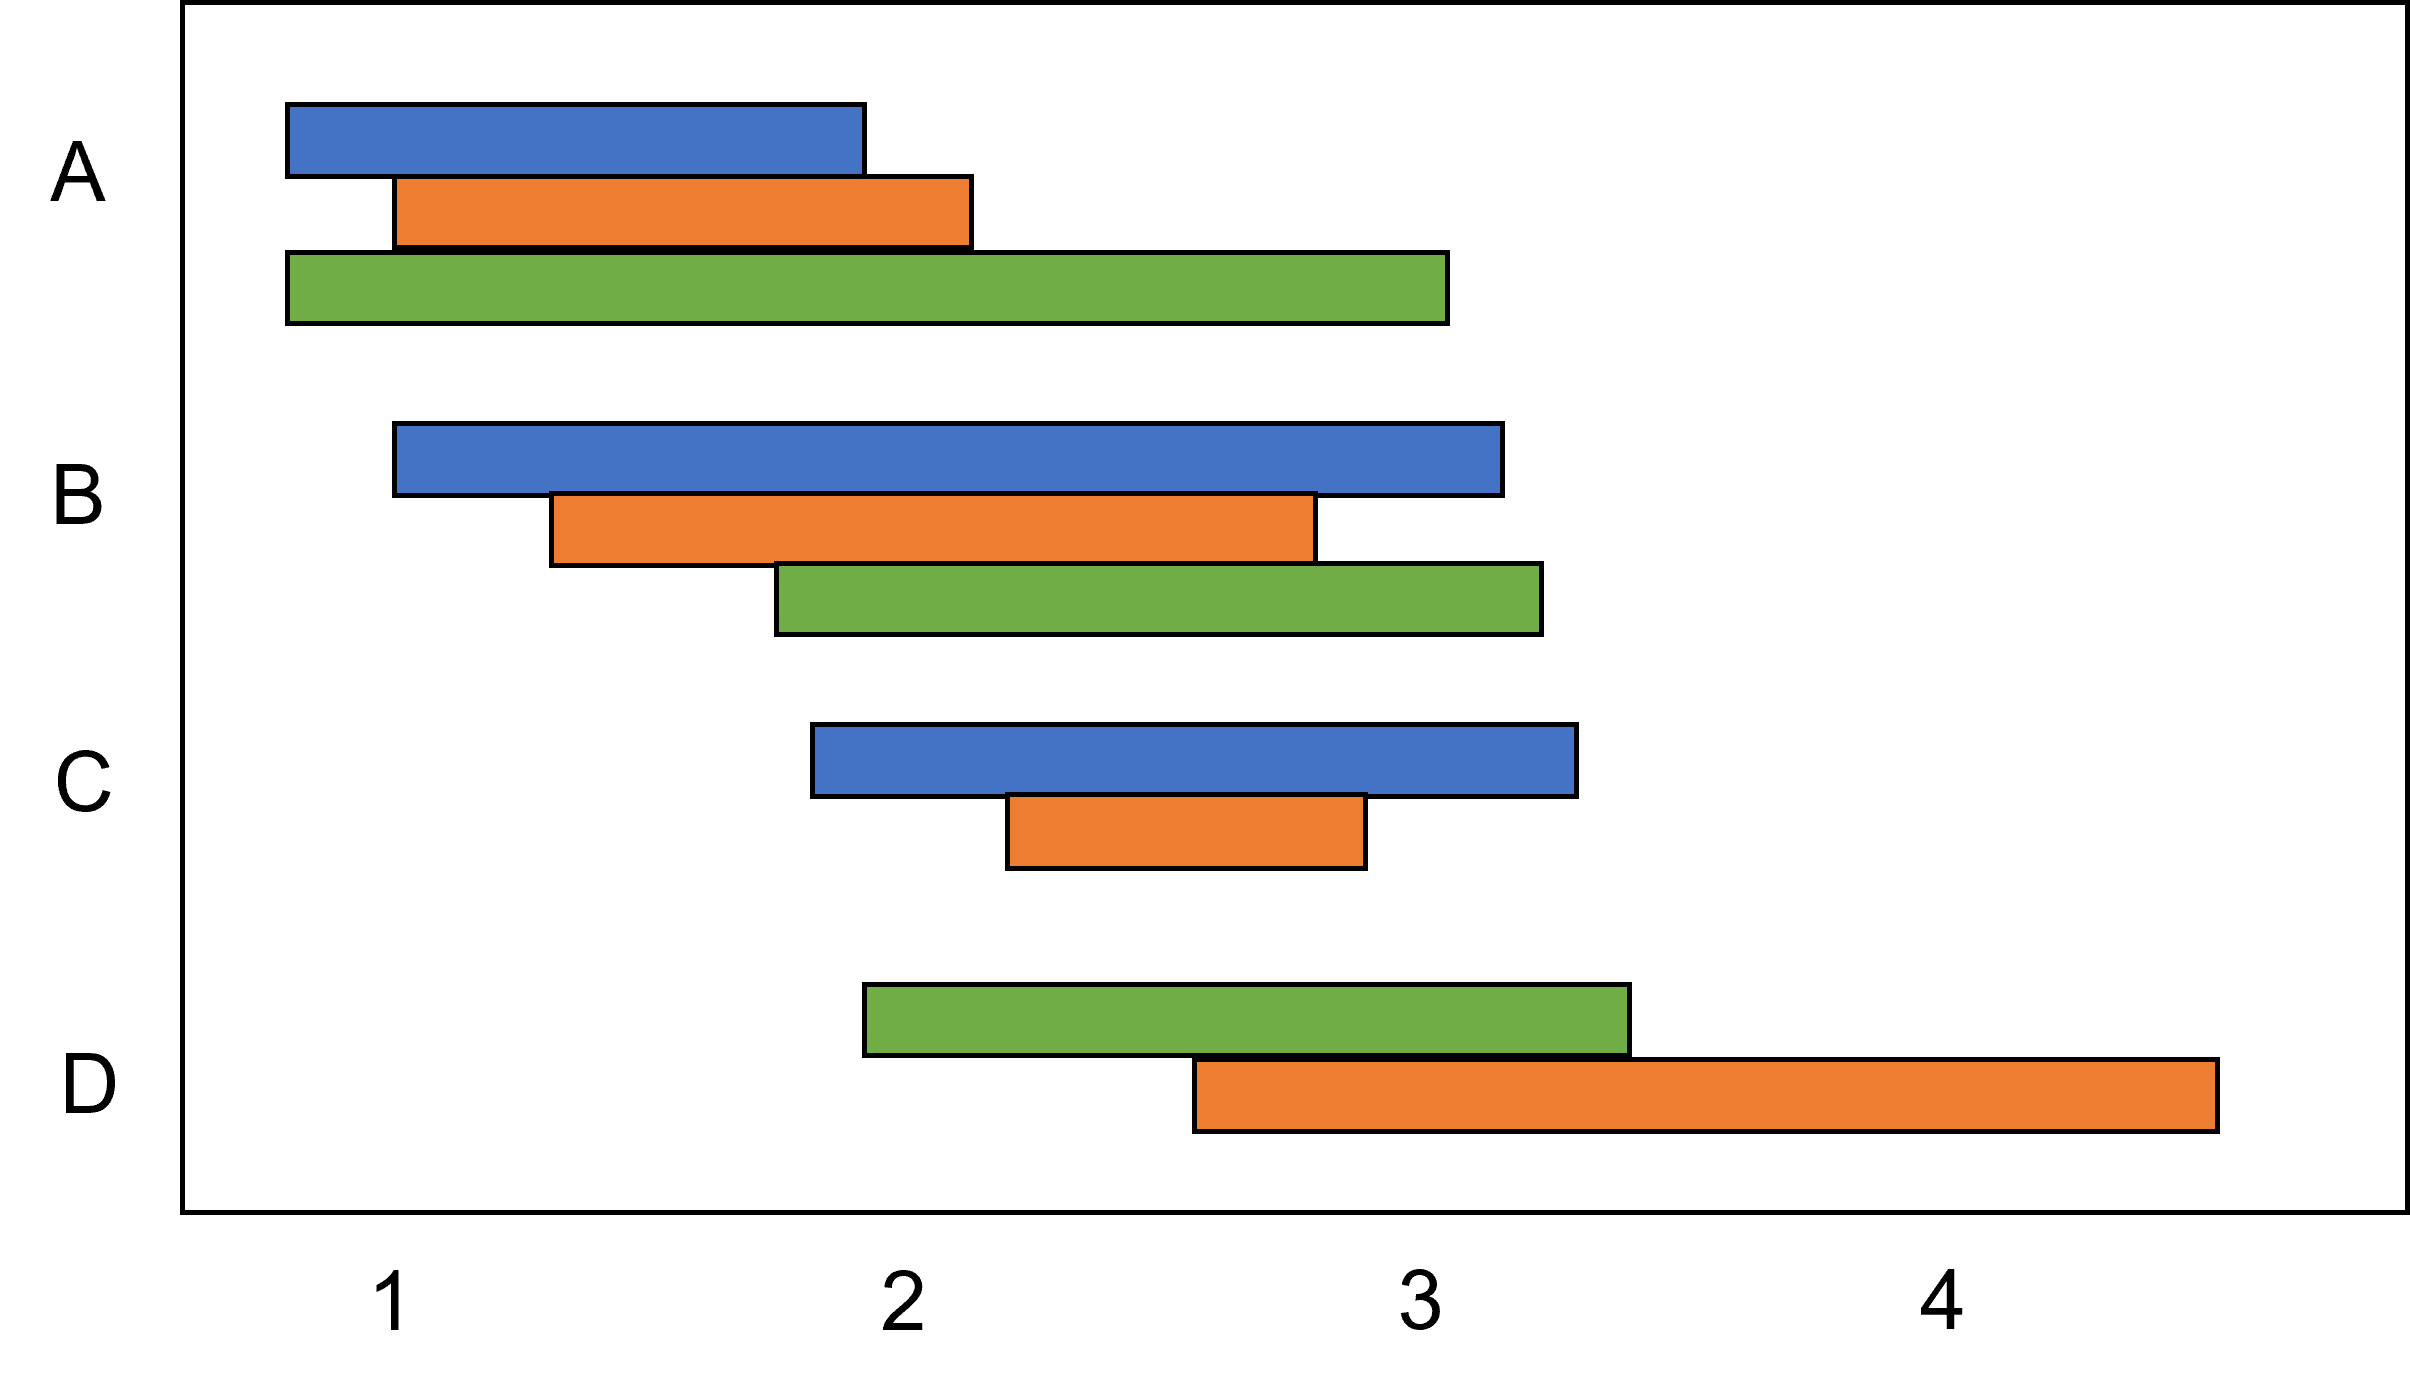
I am trying to figure out how to make a floating bar plot (where each column has a range of values). I don't find this option in Category plot... Any idea how to do this?
I sketch the figure below to exemplify what I aim to do.
Thanks!
C.
I'm not sure if there is a way to do this directly. When I have needed to do something similar, I have coded up a 2D wave with x and y columns that have: start and stop coordinates followed by a nan row for each "bar". I used "lines between points" (with lsize >2). Colours can be specified in a second wave, and using f(z) to change the display.
July 18, 2021 at 11:14 pm - Permalink
In reply to I'm not sure if there is a… by sjr51
KurtBHere is an example:
The resultant graph is attached.
The trick in this example is to use one wave for the lower value of the floating bar, and another for the length of the bar. Then in the category plot, choose 'stack on next' in the grouping options.
Hope this helps.
July 19, 2021 at 02:06 am - Permalink
In reply to Here is an example: Make/O… by KurtB
CPFThank you both, very much!!
July 19, 2021 at 09:33 am - Permalink
A variation on this that avoids the need to make the difference wave is to use grouping mode "Draw to Next":
Note two things: toMode = 1 for the FIRST trace, and the second trace is hidden.
I also set the left axis to "Autoscale from Zero", and failed to do the SwapXY thing, which is required to get horizontal bars.
July 19, 2021 at 11:31 am - Permalink