Need help plotting a timeseries that only shows the year


Hi,
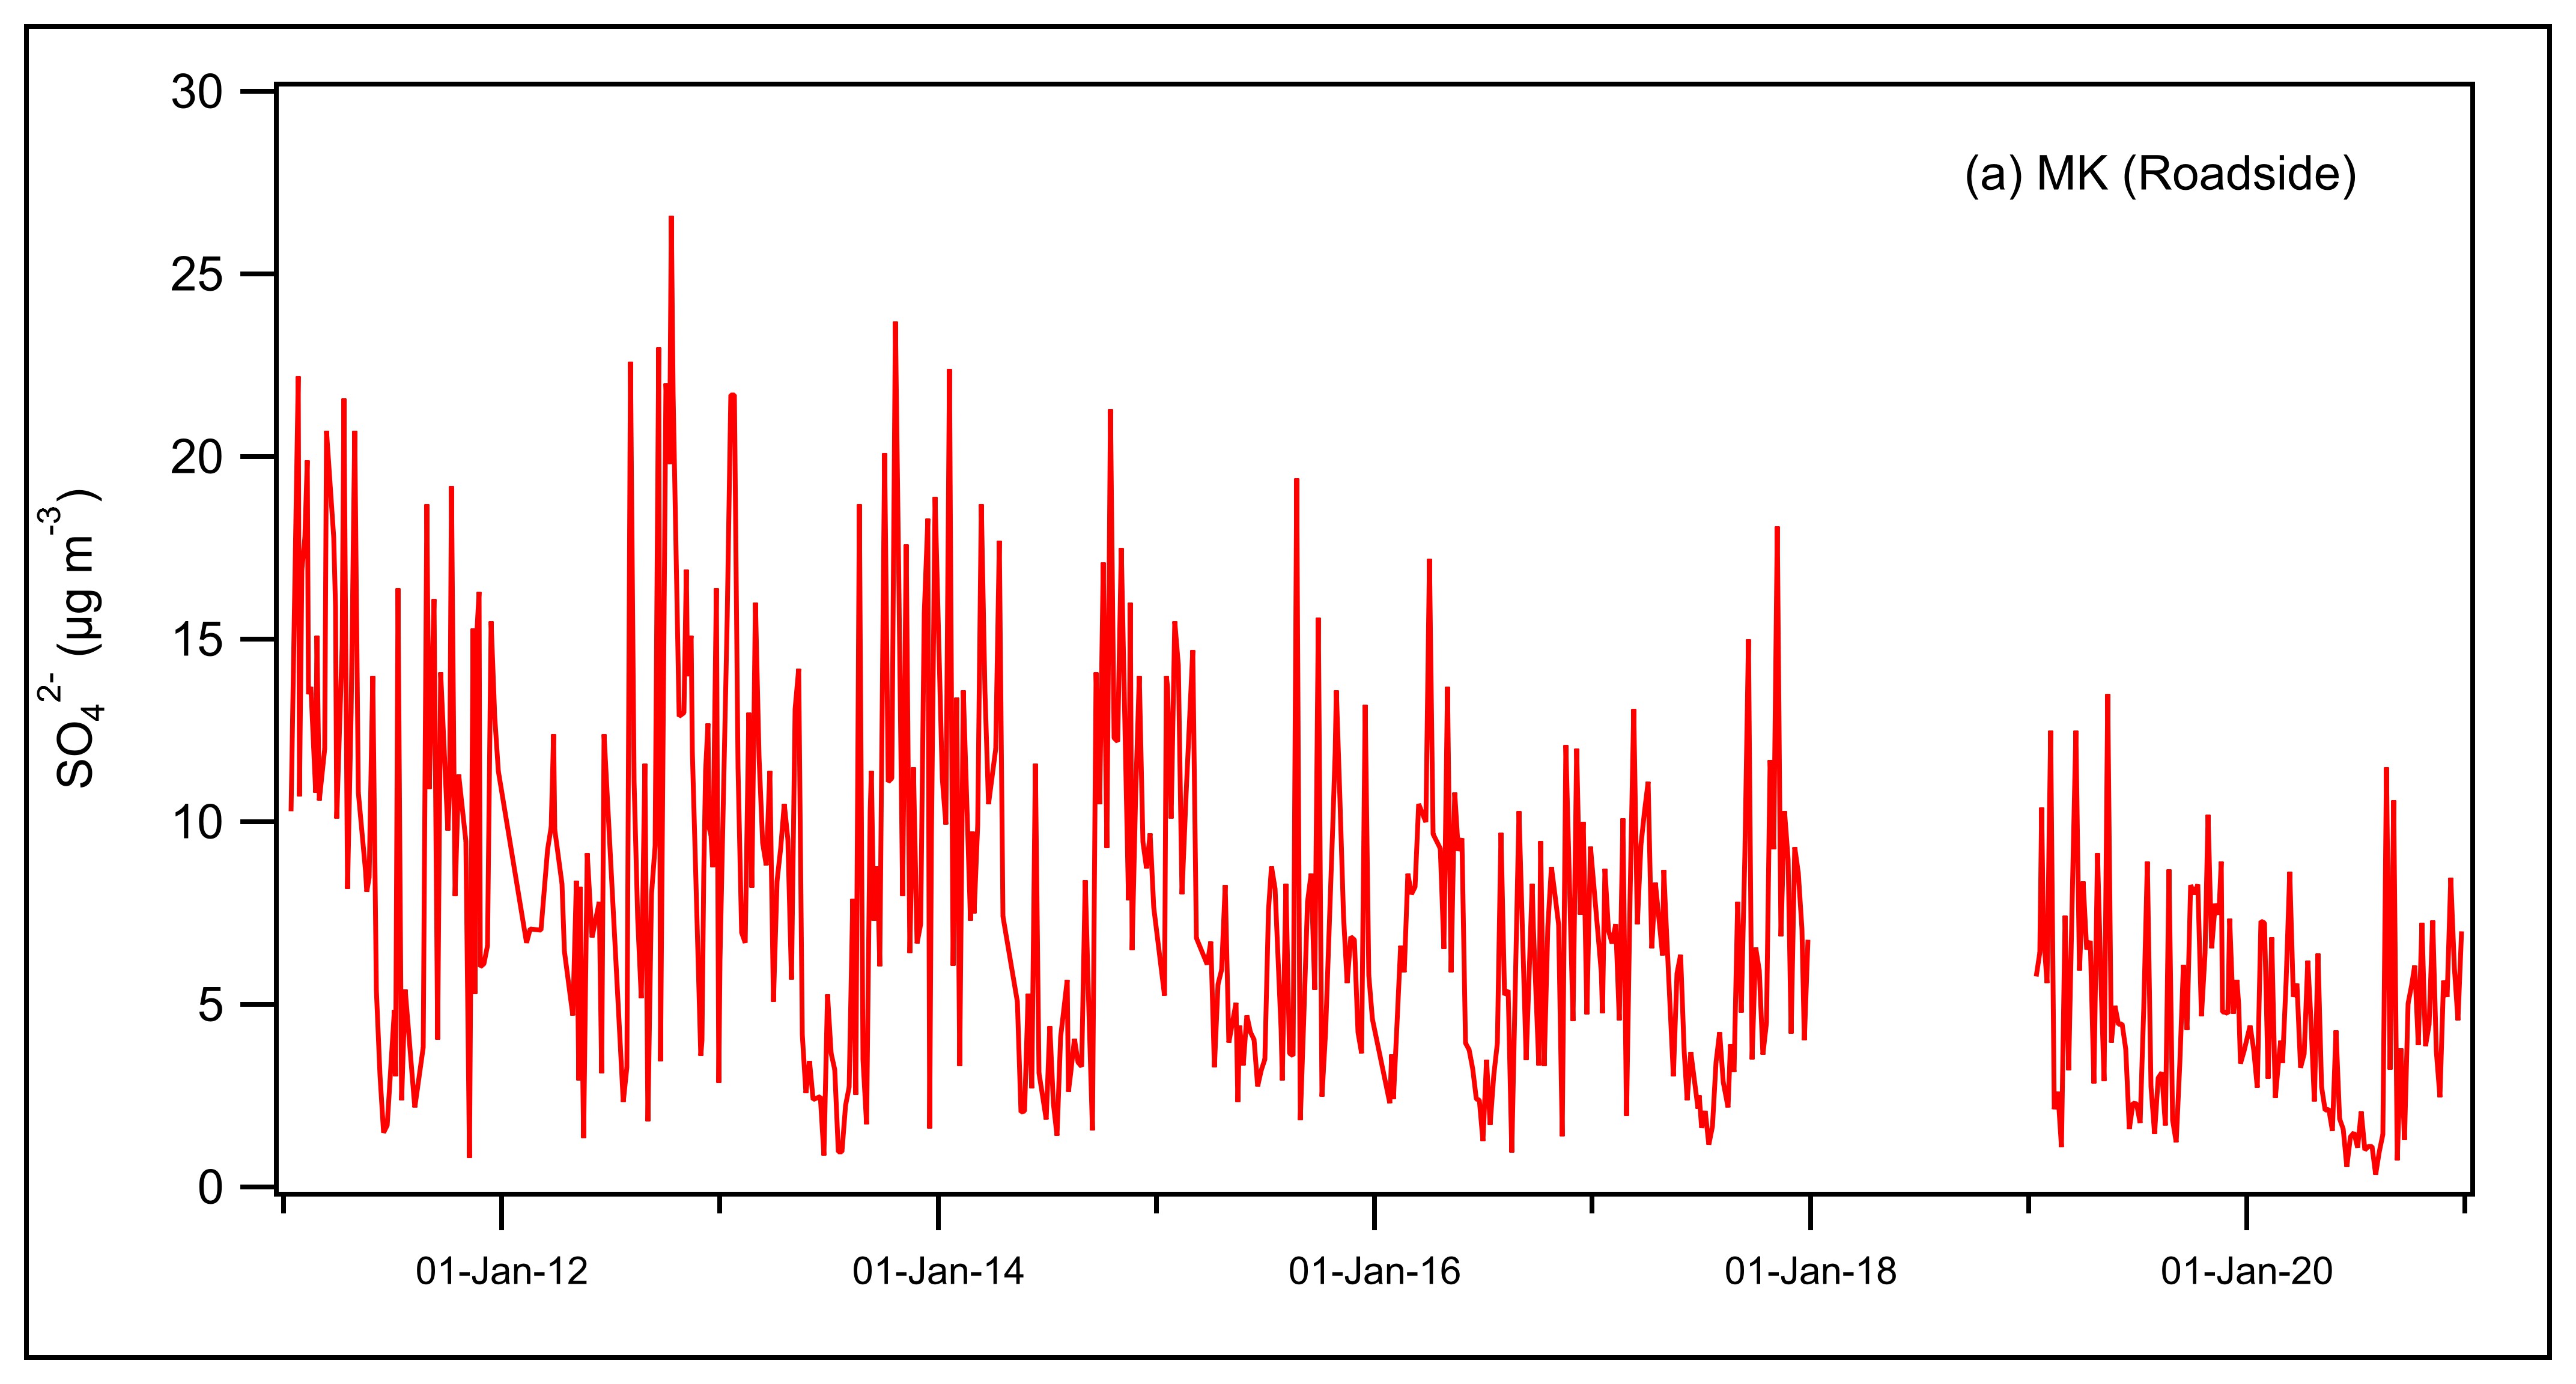
I am plotting 10 year time series of some chemical components in ambient particulate matter. How do I get the major ticks on the x axis to only show each year? Right now, the major ticks on the x axis show the full date. For example, one of the ticks shows "01 Jan 2012" but I only want it to show "2012". Thanks!
Try:
You can access this via Modify Axis... Ticks and Grids... Date/Time Tick Labels -> Date Format -> Other... Use Custom Format...
Hope this helps.
August 12, 2022 at 05:36 am - Permalink