Understanding Hough Transform Output


The data is the result of microscopic inspection of sample and the x-y locations of a defect. The question we are trying answer and quantify is are the defects the result of a larger effect.
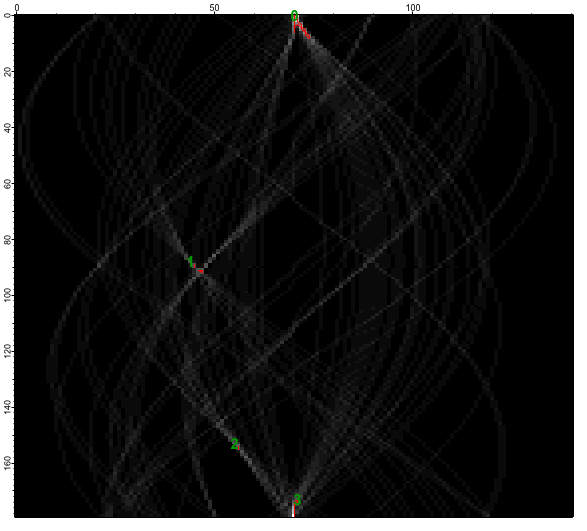
I create a binary image with the dots representing the XY locations. I do a Hough transform and then I used particle analysis to identify the hot spots.
As I understand the output the Row value should be the angle and the column should be the radial distance and the reference point should be the center of the image.
"The result is saved to a 2D wave M_Hough in which the rows are the angle domain and the columns are the radial domain."
The transform picks up four lines and that corresponds to the image. and if I look at the data from particle analysis. First it seems as it is switched. If we assume that the original image was scaled to 100 by 100 and if the reference point is 50,50 (center of the image) then for points that are 0 or ~180 (173) the greatest possible distance is 50, but they are listed at an assumed ~70.
X Y
70 0
44 88
55 153
71 173
I have obviously done something wrong, so how do I get back on track?

I'd recommend the simple example in the Image Processing Tutorial. It would show you right away that the columns correspond to angle. Simply execute:
... and yes, I will fix the documentation :)
Note that the operation also supports an enhanced resolution factor via /F. By default the resolution factor is 1 and so you get 180 columns. The number of rows is determined by 2*r_max+1 and r_max is computed from the input rows and cols:
r_max=sqrt(rows^2+cols^2)/2.
I recall seeing some papers on this in the 80's related to laser inspection of surface finish.
A.G.
WaveMetrics, Inc.
February 6, 2012 at 04:16 pm - Permalink