Zooming All X Axis
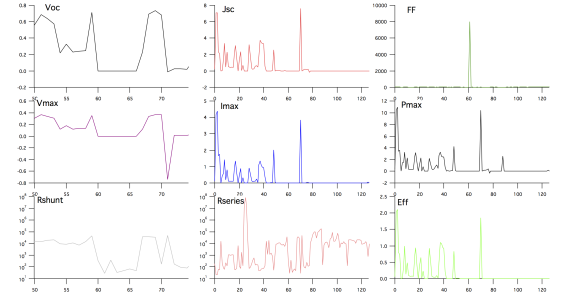
I have a master interface which consists of a grid of 3x3 graphs. Each graph has its separate x(bottom) and Y(left) axis. The behavior I would like is for the user to be able to zoom the bottom axis range and all 9 axis show the same range. When I do it for 1 set all bottom axis the column of graphs change, but the graphs in the other columns do not.
The attached image shows the bottom axis in the left column zoomed. How do I program the other bottom axis to match? I do not see an event in window hooks to detect zoom.
Thanks in advance.


Or, if your bottom axes are free axes, you could install an axis hook using ModifyFreeAxis, but unless you need them to be free I think using the modified event of the window hook is easier.
February 18, 2013 at 04:10 am - Permalink
That worked.
February 18, 2013 at 11:41 am - Permalink
I am new in Igor and your master graphs is very nice!
Could you share your procedure?
It can be a good starting point for me.
Thank you in advance
adarga
February 18, 2013 at 04:02 pm - Permalink