FFT X_scaling


Hi Igorians
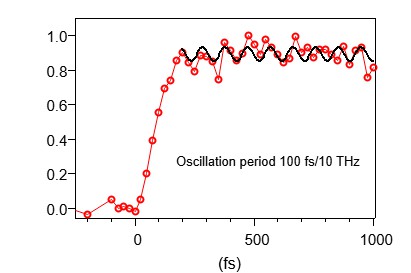
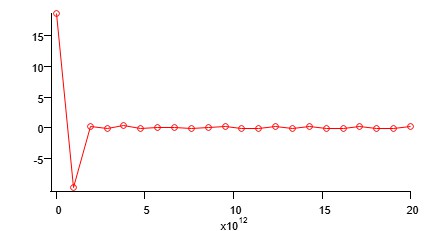
I am trying to do a FFT transform of a real wave, however I am not getting the expected frequency from the transform. I tried doing some X-scaling looking at the help file but cannot come up with a good number. Could anyone please suggest what am I missing here? Also the FFT spectrum starts from x = 0 and does not look symmetric. It is the same case when I tried to do DWT transform. Here is the code snippet I am running. I have also added figures for raw spectrum and the FFT result.
Proc  TRK_FFT_2()

	Duplicate/O/R=[8,49] TRView_tdepArea4 mywave
	SetScale/P x -25e-15, 25e-15, root:mywave
	FFT/OUT=2/WINF=Hanning/RP=[8,41]/DEST=mywave_FFT  mywave
	Display mywave_FFT
	ModifyGraph mode=4, marker=8
I have a few questions about your approach.
* You extract the spectrum over the range [8,49]. Then you FFT the extracted wave in the range [8,41]. Why not just extract the range [16,inf] from the spectrum?
* You use SetScale with a starting point below zero in extracted wave. Shouldn't this be a starting point above zero?
* You use SetScale with a step size 25e-15. Why not simply use 25 and recognize the femtosecond as the unit (e.g. "fs" for the unit designation)?
I will be surprised otherwise when you can obtain an FFT with sufficient resolution to find a specific fundamental oscillation in the period above 200 fs. The signal to noise ratio (S/N) in this region seems to be rather poor. Suppose that you expect this region to have a specific fs oscillation. Here is a test to see the baseline noise in your spectrum.
* Extract the region above 200 fs into a wave starting at zero with a step size 25 (fs) for the x scale -> roiwave
* Create a new wave with exactly the same length as the extracted wave. Set its start at zero and step at 25 (fs) for the x scale -> idealwave
* Plot the two waves on the same graph.
* Create a function to set idealwave using a sin (or cosine) with a variable amplitude A, frequency offset point phi, and oscillation omega. By example, calc_ideal(A, phi, omega) -> A*sin(omega*x + phi). Run this function with variations in (A, phi, omega) until you "see" by eye what you might claim to a a good fit.
* Create a relative residual wave as relres = (roiwave - idealwave)/idealwave. At infinite S/N, relres will be zero. A general guideline is to have S/N > 3 to resolve a signal from noise. With this in mind, if relres is not within ± 0.33, your S/N is too poor to extract the true underlying signal.
February 26, 2023 at 07:08 am - Permalink
In reply to I have a few questions about… by jjweimer
TRKThank you jjweimer for your feedback.
I like your suggestion on subrange extraction from the wave. The reason I choose points below zero was to see if I could get a symmetric FFT curve which however didn't work. And I am still getting asymmetric FFT curve (similar to the second jpg image attached in the first post and has left tail at max intensity)
I liked your idea of finding S/N ratio. However I added a constant in front of a cosine function to match the amplitude of roiwave.
The S/N ratio is within +-0.33 within the roiwave range however my roiwave signal was already normalized though. The signal at infinite does not go to zero due to limited data points for roiwave. Do you have any suggestion on this? The code snippet is pasted below
I am again coming to my initial query. Why the FFT spectrum is not showing the right frequency? Does it have to do with Xscaling? and why is it not symmetric? And when I display my FFT spectrum, the unit comes in 'mfs' for the unit 'fs' in roiwave
February 26, 2023 at 06:40 pm - Permalink
Take a look at the help for Fourier Transforms by executing this command:
Then pay close attention to the description below "Changes in Wave Type and Number of Points", specifically:
And take a look at the difference between one-sided and two-sided spectrums, as well as "Changes in X Scaling and Units".
Your answers lie therein.
February 26, 2023 at 07:51 pm - Permalink