Joint Histogram Function for Ramachandran Plots


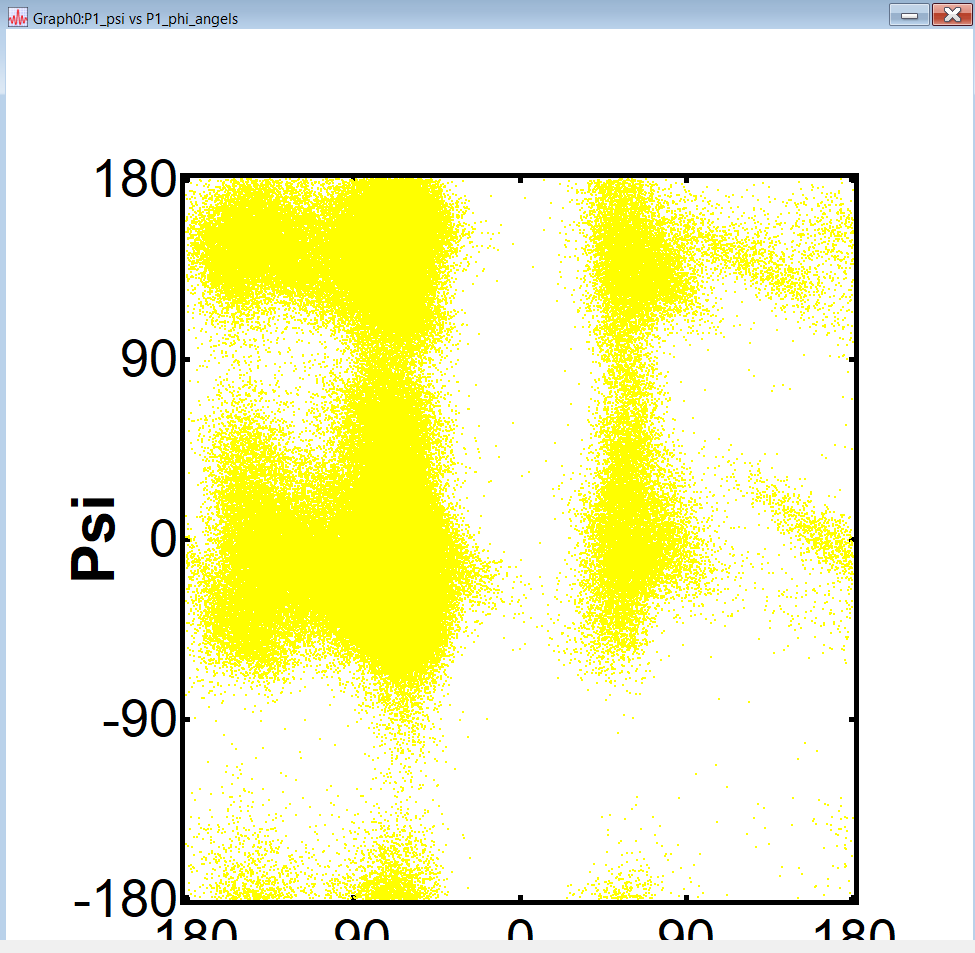
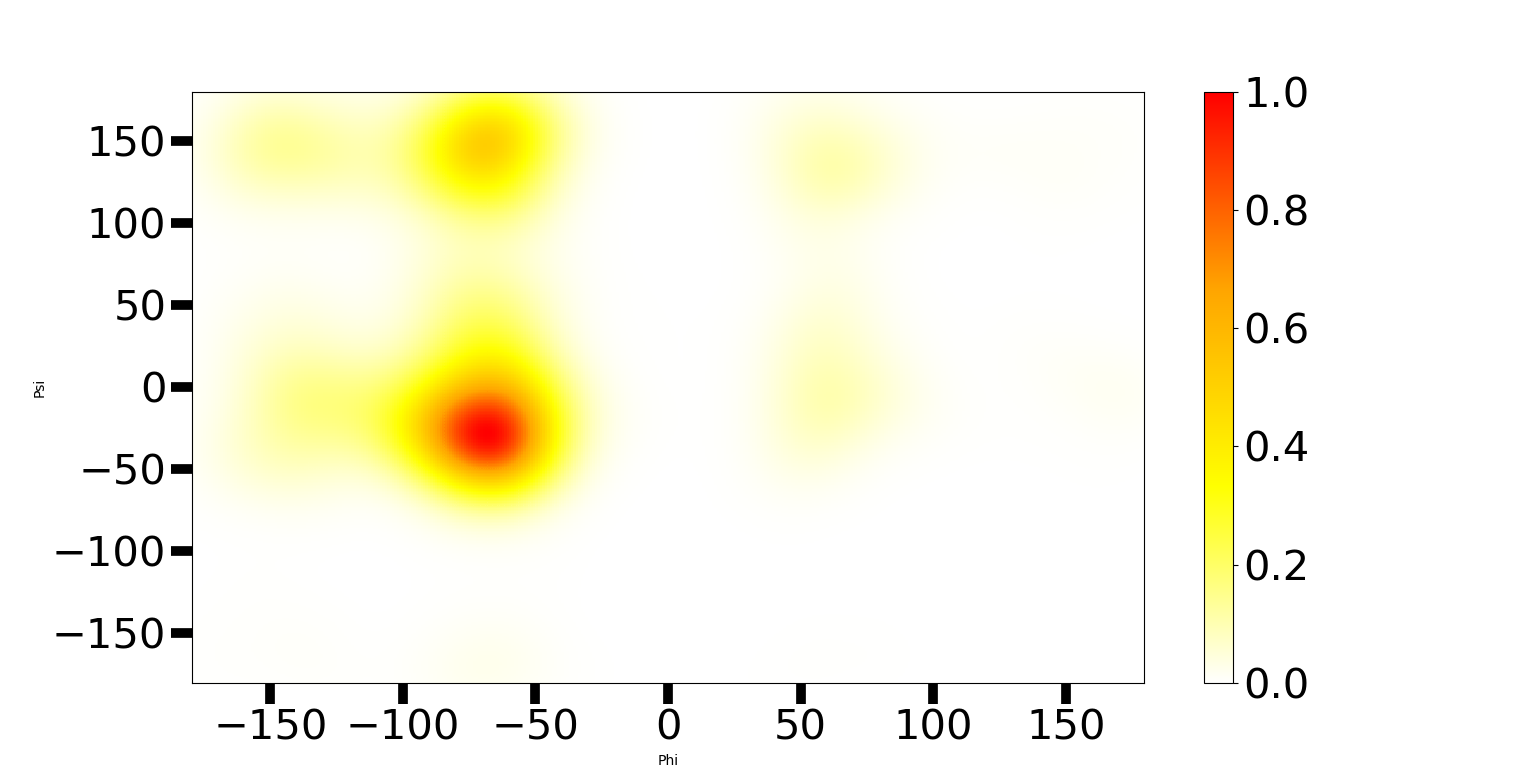
I am currently working on Ramachandran plots for the dihedral angles obtained from MD simulations. I have uploaded the data into Igor and developed a scatter plot of the psi and phi angles. However, I am unsure how to use the JointHistogram function to make the Ramachandran plots of psi vs phi. Is there something I need to calculate? I know once I use the function, I can Append a contour plot onto the scatter plot that I have created. I do not know how to proceed. I am attaching my scatter plot to this post. I am technically missing the color gradient for the densities (including a plot I made using python as a comparison).
Hi,
To get a color scale, go to add annotate in the graph menu and select colorscale from the annotation type. You may have to rearrange axis and others to make space for the color scale.
As far as the two graphs you are showing, they have the same basic form so I thing you have the basics ok. One question would be the binning size you used. The Igor plot seems a bit binary with a fine texture as if each populated bin has a count of 1 and the others 0. If you examine the values do they fall into meaningful ranges and values. Look at the joint histogram in a table. The other way is to use the joint histogram wave in a gizmo plot and use a 3D bar chart to see heights.
If that comes out to your satisfaction, then I would look to modify image to see the color range that is being used makes sense.
Andy
April 13, 2020 at 04:55 pm - Permalink
In reply to Hi, To get a color scale,… by hegedus
horinsI cannot do the color scale without having the values I need, and I am having trouble with knowing the numbers I need for the joint histogram table. I put int #include <Bivariate Histogram 2> in the procedure window, but I know I need a code that applies it for the density plot. I do not know what code it is. I tried this code that I found on the forum, but it does not work and says this error message for the first line: expected wave name, variable, or operation
April 13, 2020 at 05:25 pm - Permalink
In reply to I cannot do the color scale… by horins
hegedusHi,
Would it be possible to upload the two data waves, P1_phi_angels, P1_psi?
Andy
April 13, 2020 at 07:18 pm - Permalink
Assuming that you have Igor 7 or newer the following function gives you a basic density plot based on the JointHistogram operation:
April 14, 2020 at 12:28 am - Permalink
Thank you for the help! I was able to successfully complete the plots. Turns out I only needed this part of the code:
April 14, 2020 at 10:00 pm - Permalink